Support homeCloud AnalysisTutorials
Cell Annotation Pipeline

Cell Annotation Pipeline

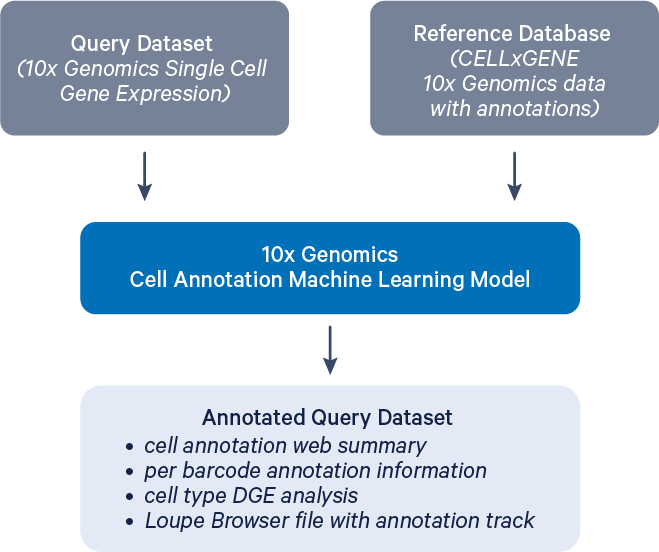
The annotation model was co-developed by 10x Genomics and the Cellarium AI Lab at the Data Sciences Platform of the Broad Institute.

Cloud Analysis introduces a new beta pipeline for cell type annotation, which can be applied to standard Cell Ranger count and multi outputs to generate accurate cell type labels.

This page explains how to run the annotate pipeline and outlines the expected output files using a publicly available dataset.

Start with the outputs of cellranger count or cellranger multi:

Before running the cell type annotation, ensure that you have already processed your data using either the cellranger count or cellranger multi pipeline. These pipelines must be run in Cloud Analysis, as you cannot begin by simply uploading the outputs, and must be run with the human reference.

Note: A .cloupe file will only be generated if secondary analysis is enabled during the initial run.

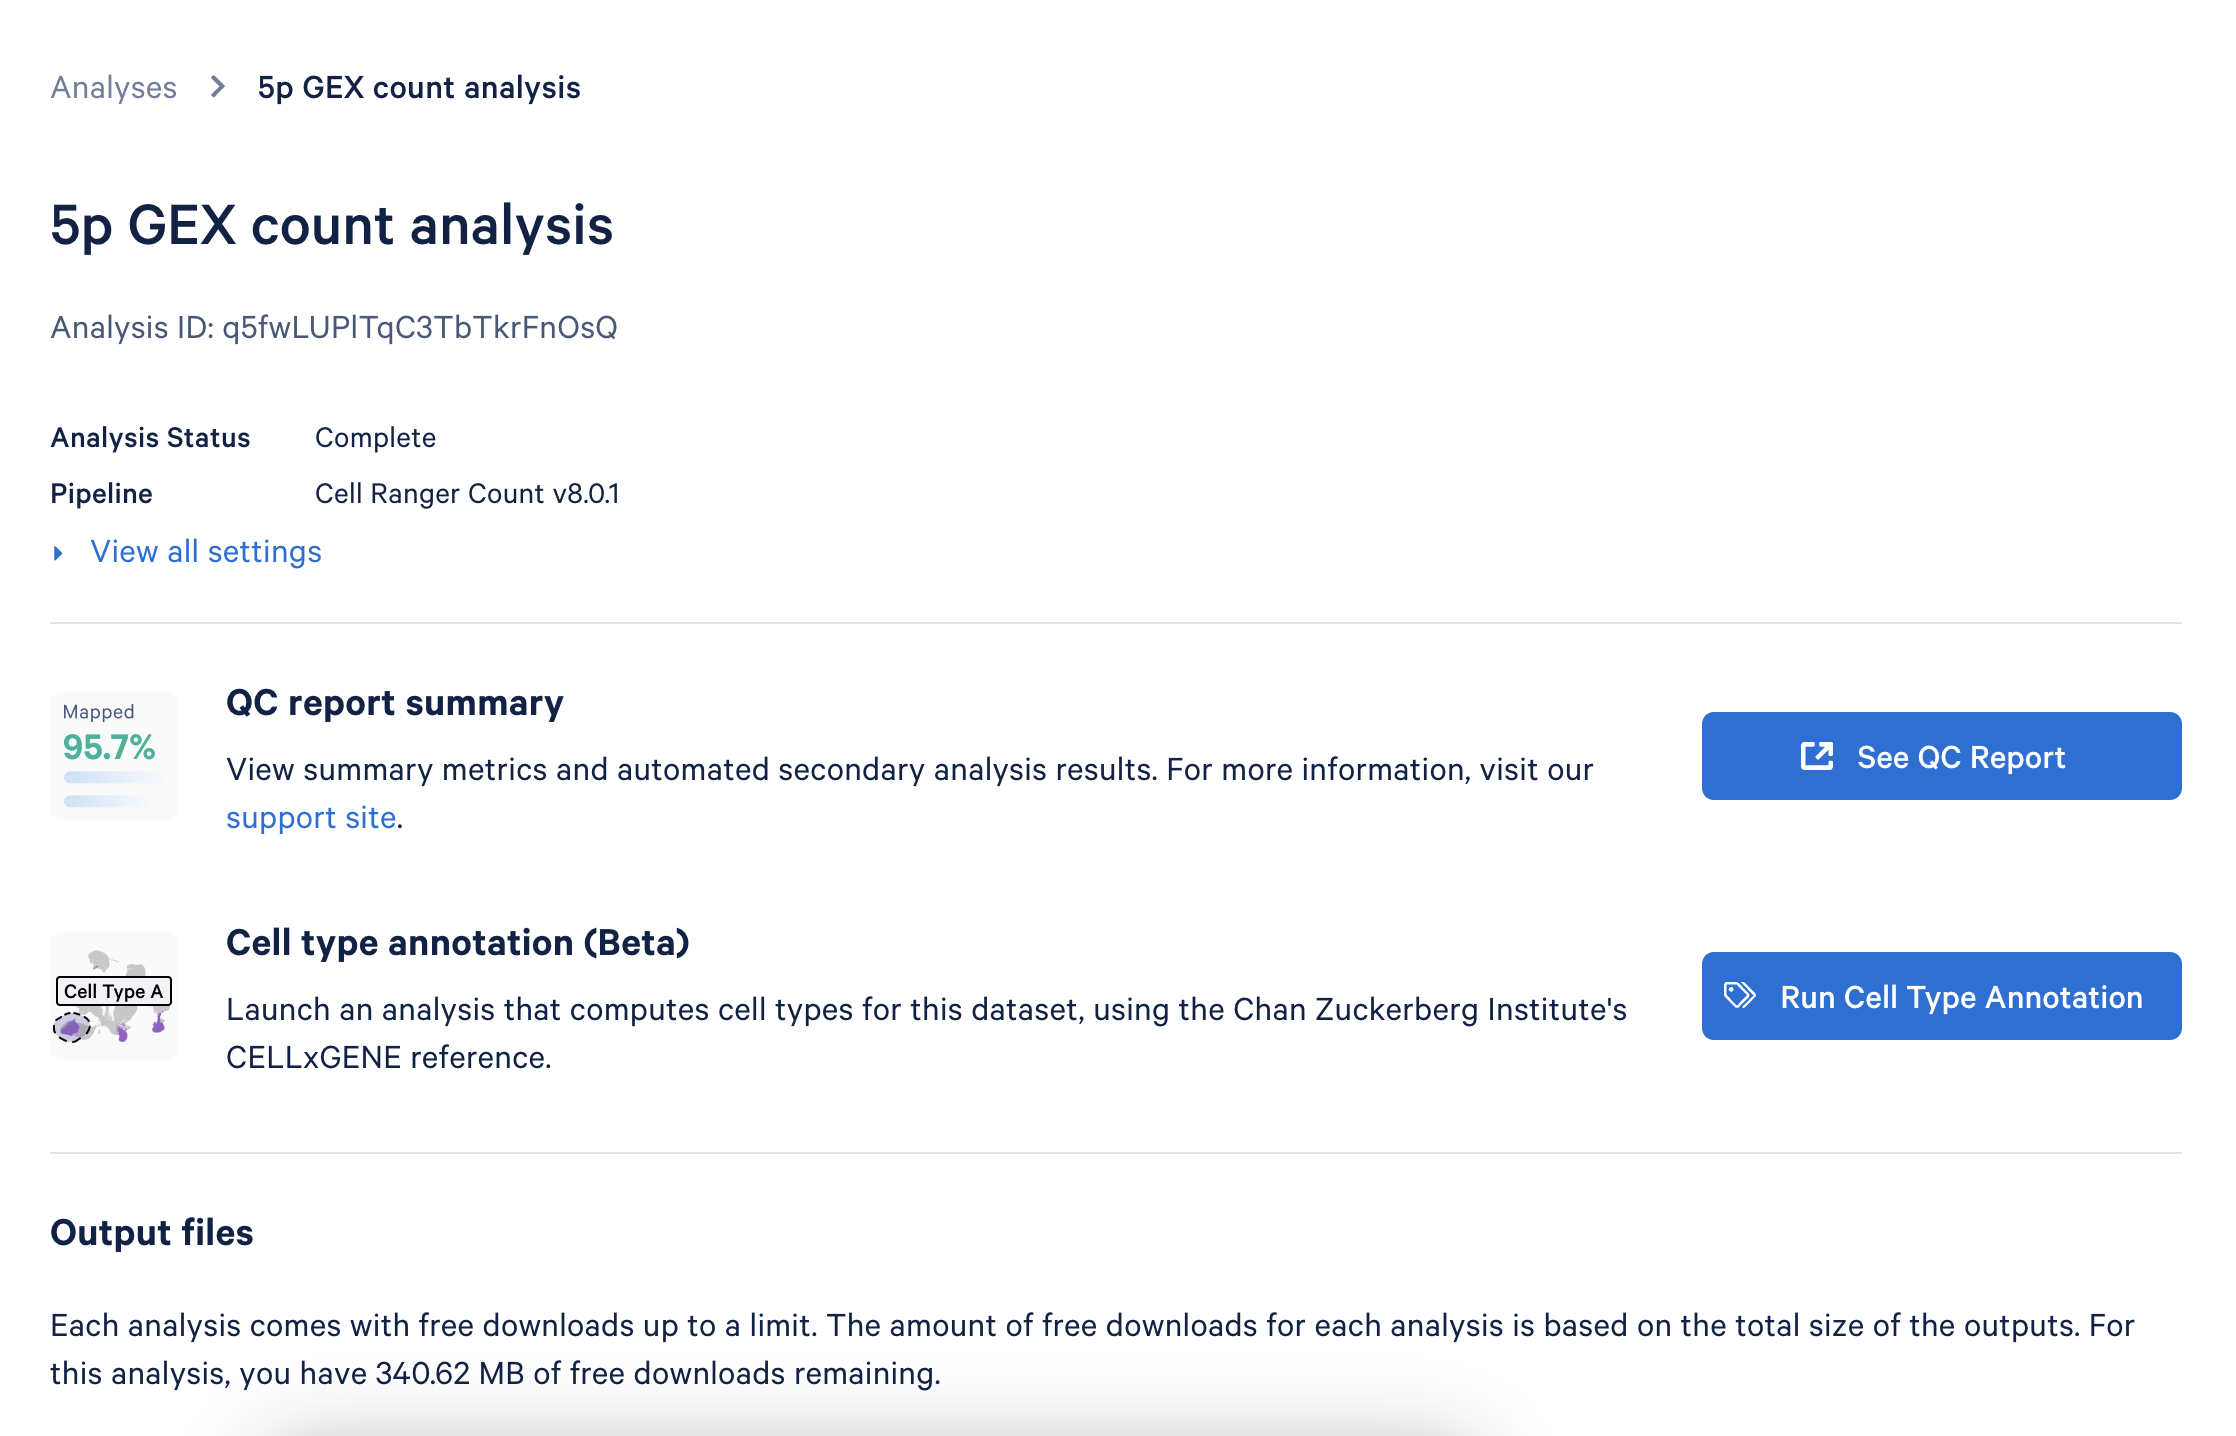
Go to the Analysis tab in the interface and select the analysis you wish to annotate. Click the Run Cell Type Annotation button to start setting up.


This will take you to the annotation setup page:
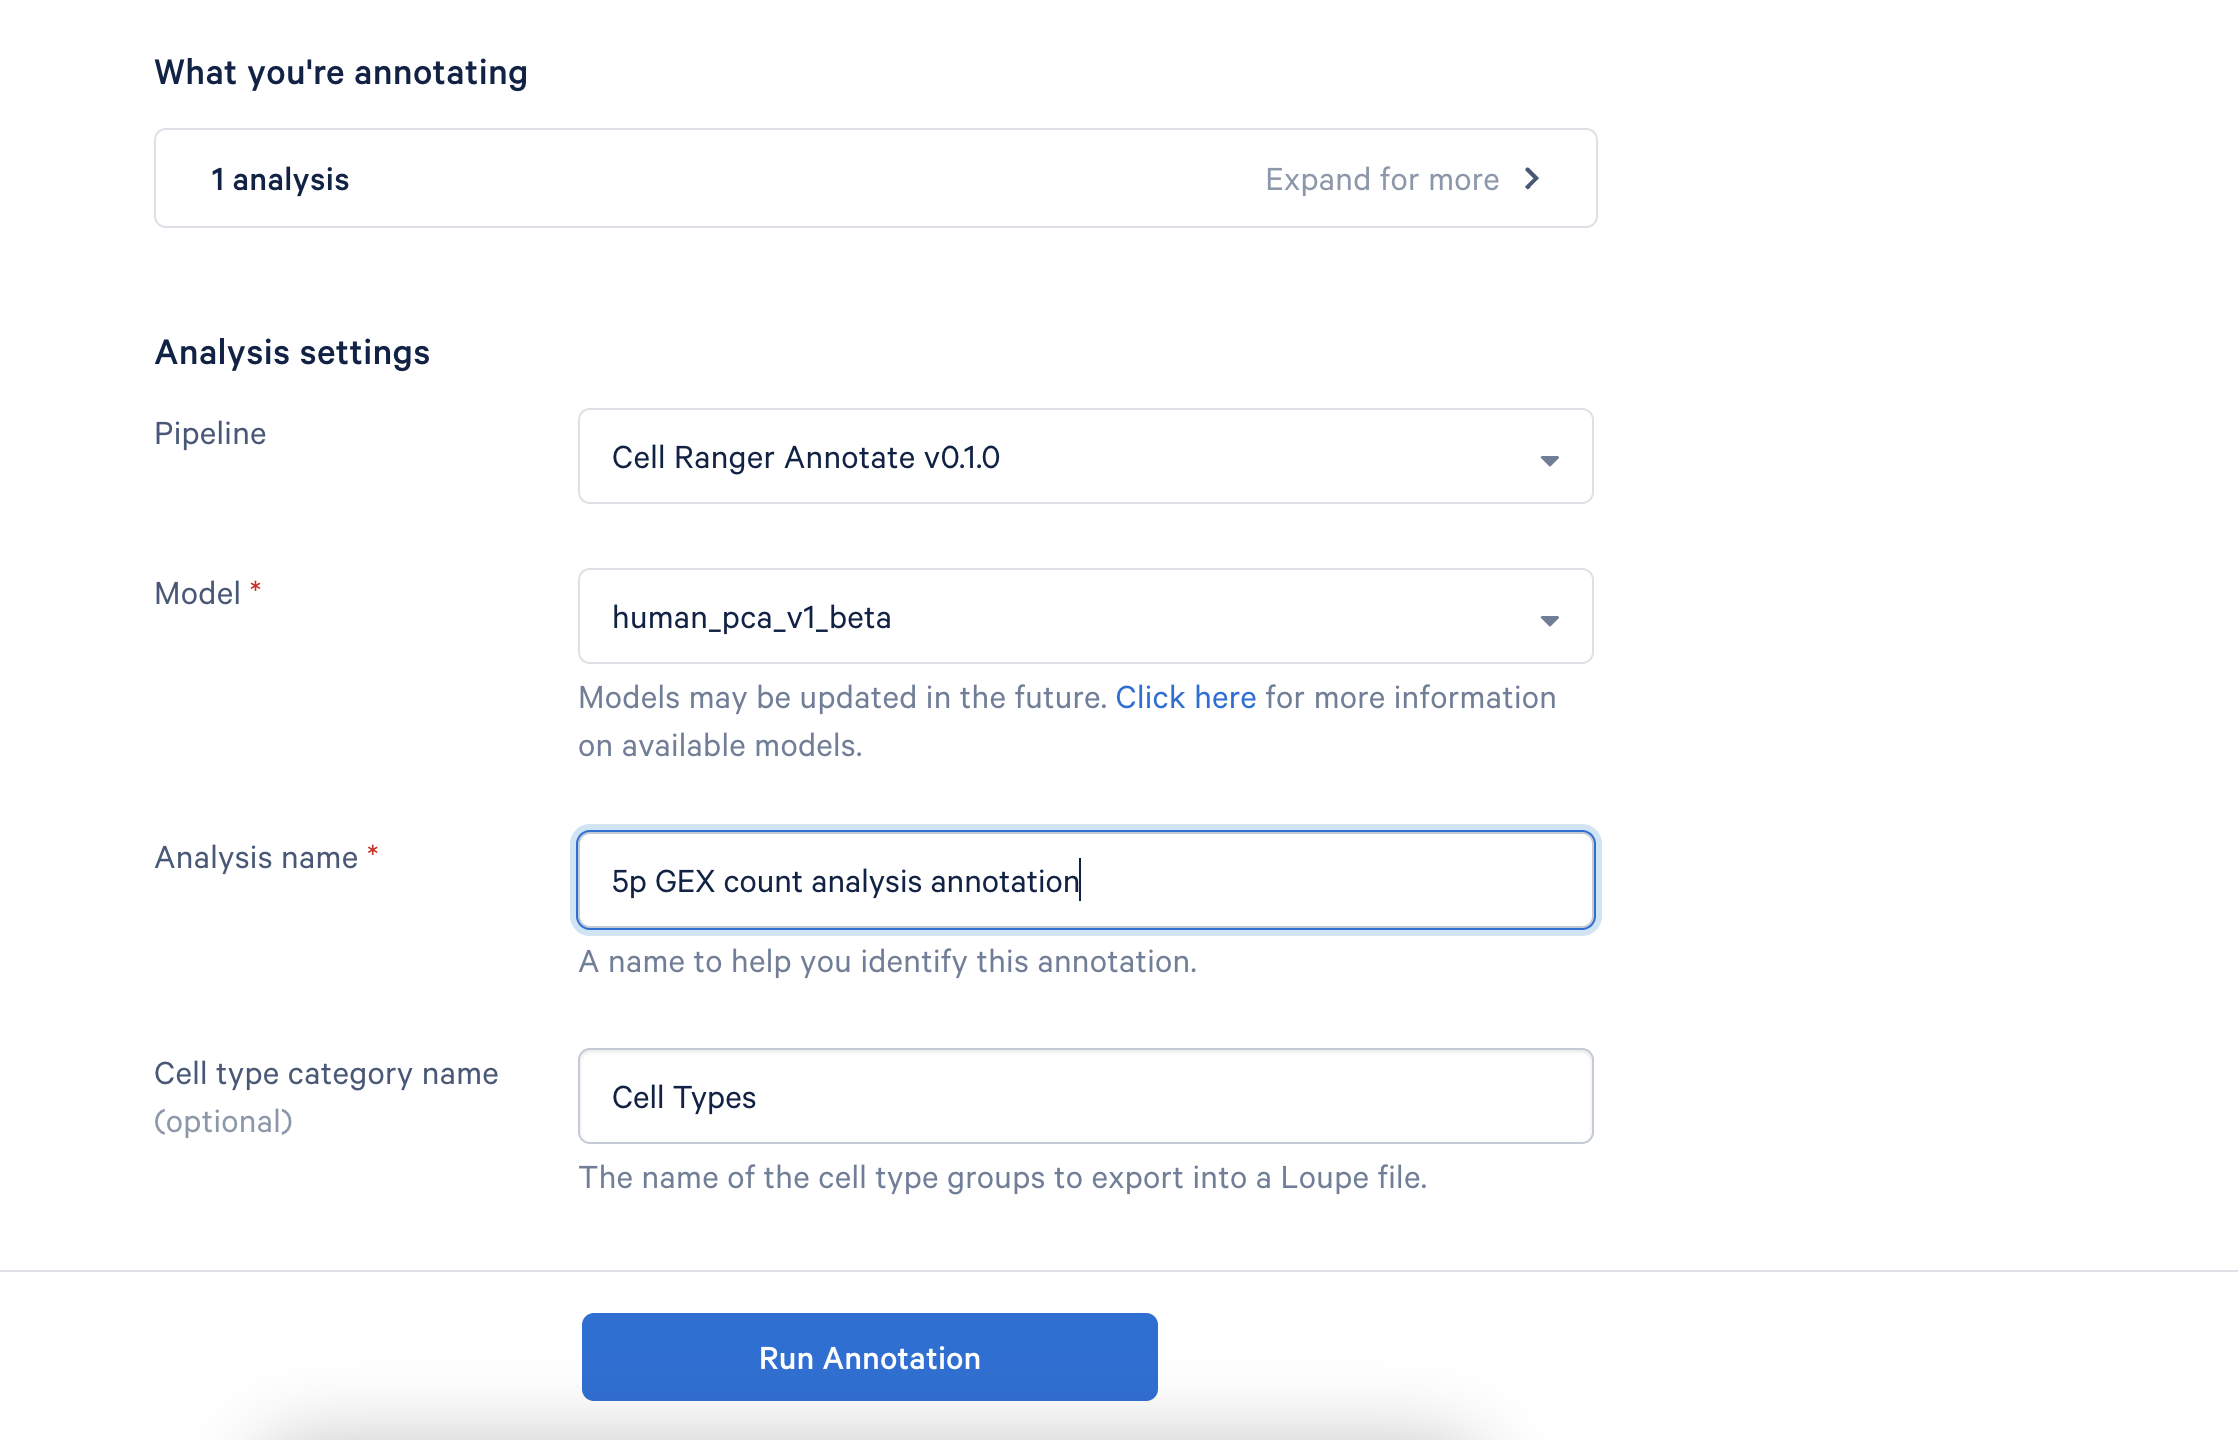


Provide a descriptive name for your analysis to help you easily identify it later. If desired, you can rename the "Cell Type Category" that appears in Loupe Browser.

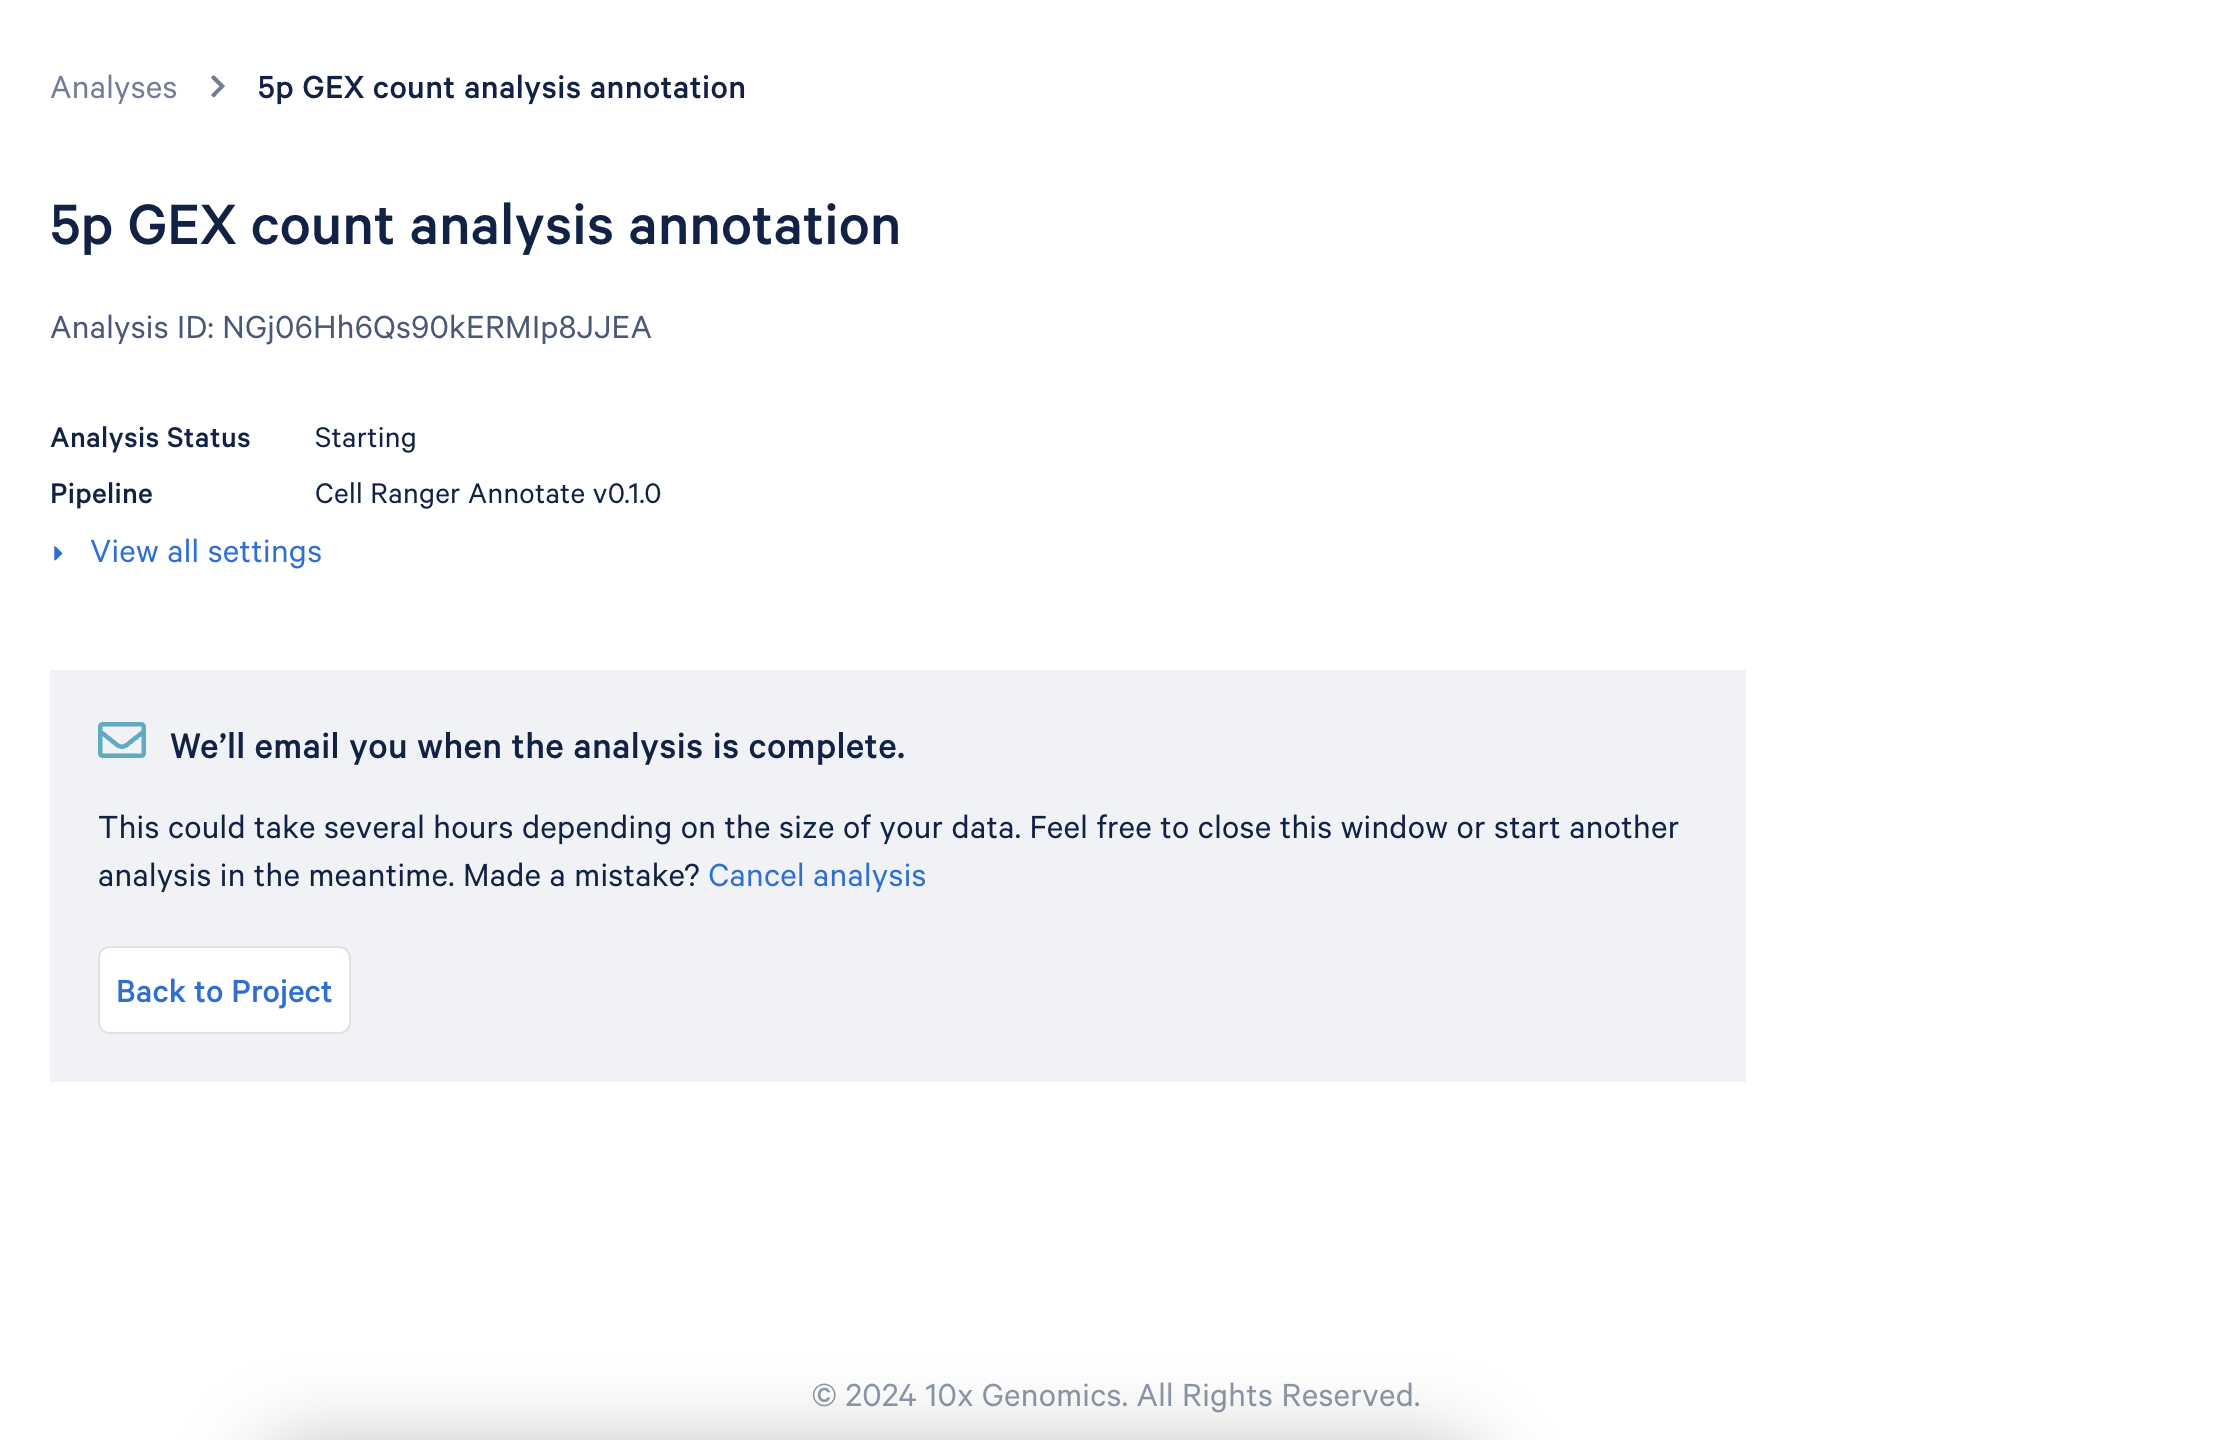
Click Run Annotation to begin the process. You will receive an email notification once the analysis is complete.
FileDownloaded file nameDescription
Annotation web summaryweb_summary_cell_types.htmlView high-level cell types, metrics, and distribution.
Loupe Browser filecell_annotation_sample_cloupe.cloupeThe Loupe Browser file from the original analysis, annotated with high-level cell types.
Annotation by cellcell_annotation_results.json.gzDetailed evidence of how each cell has been assigned a cell type by the algorithm, broken down by dataset IDs in the reference database and nearest-neighbors in each.
Cell types CSV filecell_types.csvA CSV file listing course and fine cell types for each cell.
Differential expression CSVcell_annotation_differential_expression.csvTable listing genes that are differentially expressed in each detected cell type, along with log2 fold-change and associated p-value.

File Name: web_summary_cell_types.html

Description: A standalone web summary that presents key statistics and visualizations related to the annotation of your sample. This interactive file provides high-level metrics and plots, allowing you to explore the distribution and characteristics of cell types in your dataset.

Key summary visualizations and tables generated from running the annotation pipeline on a publicly available 10x Genomics dataset are described below.

Cell Type Composition Barchart

This chart provides a high-level summary of the cell types present in your sample. By clicking on each bar, you can explore more detailed annotations, revealing the contribution of specific subtypes to the broader cell types. This interactive visualization helps you quickly assess whether the expected cell types are present and suggests potential subtypes within the sample.

UMAP projections

The UMAP projection of cells is color-coded by the annotated high-level cell type. Distinct clusters with relevant cell type labels can be used as a starting point for further annotation in Loupe. If you notice high-level cell types appearing in low numbers or scattered across the UMAP—particularly unexpected cell types—these should be carefully reviewed and potentially re-annotated during further analysis.


Top Features by Cell Type

This view provides another method for quality control of the annotations. For correctly annotated cells, you should expect to see common marker genes. Mis-annotated cells may show features that are not commonly expressed in that cell type.


File Name: cell_annotation_sample_cloupe.cloupe

Description: A new .cloupe file is generated, which includes coarse cell types in the "Custom Groups" section. By default, this group is labeled "Cell Types," but the name can be customized during the annotation analysis setup.

File Name: cell_annotation_results.json.gz

Description: This file is a compressed JSON containing a list of dictionaries. Each element in the list represents the annotation results from a single barcode, derived from the cell annotation model.

For each barcode, the corresponding dictionary includes the top 500 matches obtained using an approximate-Nearest Neighbor (ANN) lookup. These matches are summarized for the total number of occurrences for a given cell type. While more cells supporting a particular annotation can increase your confidence in the annotation, occasionally the most common nearest-neighbor cell type can have a low number of supporting cells because the nearest-neighbors are split amongst several highly similar cell types (e.g., 'Cd16-Negative, Cd56-Bright Natural Killer Cell, Human' and 'Cd16-Negative, Cd56-Dim Natural Killer Cell'). The dataset_id corresponds to the Chan Zuckerberg CELL by GENE (CZ CELLxGENE) study from which the annotation was derived. To view this study, insert the id into this URL: https://cellxgene.cziscience.com/e/{dataset_id}.cxg/.

An example output is shown below:

{ "barcode": "AAACCAAAGAATGCAA-1", "matches": [ { "cell_count_in_model": 32, "cell_type": "monocyte", "dataset_ids_with_counts": [ { "count_per_dataset": 30, "dataset_id": "87ce26ed-e5d1-44b4-81cc-cc5b709a169f" }, { "count_per_dataset": 2, "dataset_id": "b0e547f0-462b-4f81-b31b-5b0a5d96f537" } ] },

File Name: cell_types.csv

Description: This file contains the cell type annotation for each barcode and can be used to import the fine-scale cell type annotations directly into Loupe Browser.

The file contains four columns:

  • barcode: The cell barcode being annotated
  • coarse_cell_type: The broad classification or high-level annotation of the cell (e.g., T Cell, B Cell, Neutrophil, etc.)
  • fine_cell_type: The original annotation derived from the model based on the most common cell type amongst the 500 nearest-neighbors. Note: This may be the same as coarse_cell_type if the original reference was only annotated to that level of detail.
  • cell_count_in_model: The number of cells in the model that support the given fine_cell_type annotation, with a maximum of 500 cells.

An example is shown below:

1 barcode coarse_cell_type fine_cell_type cell_count_in_model 2 AAACCAAAGAATGCAA-1 monocyte CD14-positive monocyte 454 3 AAACCAAAGAGCCGAA-1 monocyte monocyte 217 4 AAACCAAAGCACTCCC-1 T cell "central memory CD4-positive alpha-beta T cell" 370

File Name: cell_annotation_differential_expression.csv

Description: This file contains the results of a differential expression analysis conducted between coarse cell types. These differentially expressed genes can be used to check that the cell type contains the expected marker genes. The pipeline uses the same algorithm employed in Cell Ranger and Loupe Browser to calculate fold changes and p-values, ensuring consistency within these platforms.