The cell annotation model was co-developed by 10x Genomics and the Cellarium AI Lab at the Data Sciences Platform of the Broad Institute. The model is in beta.
When you enable cell type annotation, your data is securely transmitted to 10x Genomics Cloud Analysis. Since your data is leaving your local environment and entering the 10x Genomics domain, it becomes subject to the terms outlined in the 10x Genomics End User License Agreement (EULA). Please review the EULA carefully to understand how your data will be handled and the associated usage terms. Additionally, please only use this feature if there are no restrictions that preclude your data being sent outside your local environment.
The availability of automated cell annotation is subject to restrictions based on U.S. or local laws and regulations. See regional restrictions for the list of impacted regions.
Cell annotations refer to the process of categorizing and assigning cell types to individual cells based on their gene expression profiles. These annotations are needed for understanding the cellular composition and diversity within a sample.
Cell Ranger v9.0 introduces support for automated cell type annotation as part of cellranger multi and cellranger count commands and as a standalone command called cellranger annotate. This page describes the inputs, command, and outputs for cellranger annotate.

To generate automated cell type annotations, ensure the following requirements are met:
- Your analysis includes a Gene Expression library.
- The total number of cells in your analysis range from 100 to 800,000.
- You have a 10x Genomics Cloud Analysis account.
To run automated cell type annotations with the cellranger annotate command, you will need to access the 10x Genomics Cloud CLI Access Token.
There are two ways of accessing the token:
- Run
cellranger cloud auth setup(recommended):
Cell Ranger v9.0 introduces a new command, cellranger cloud auth setup, to simplify the process of authenticating with 10x Genomics Cloud Analysis. This command provides an interactive walkthrough that guides you step-by-step through the setup.
When you run the command:
- You will be prompted to visit the 10x Genomics Cloud Analysis site, where you can generate an access token.
- After copying the token, paste it back into the command prompt, allowing Cell Ranger to save the token locally.
Once saved, the token is automatically reused for future requests, making it easier to access Cloud Analysis services without needing to repeatedly enter credentials.
- Manually create a token file
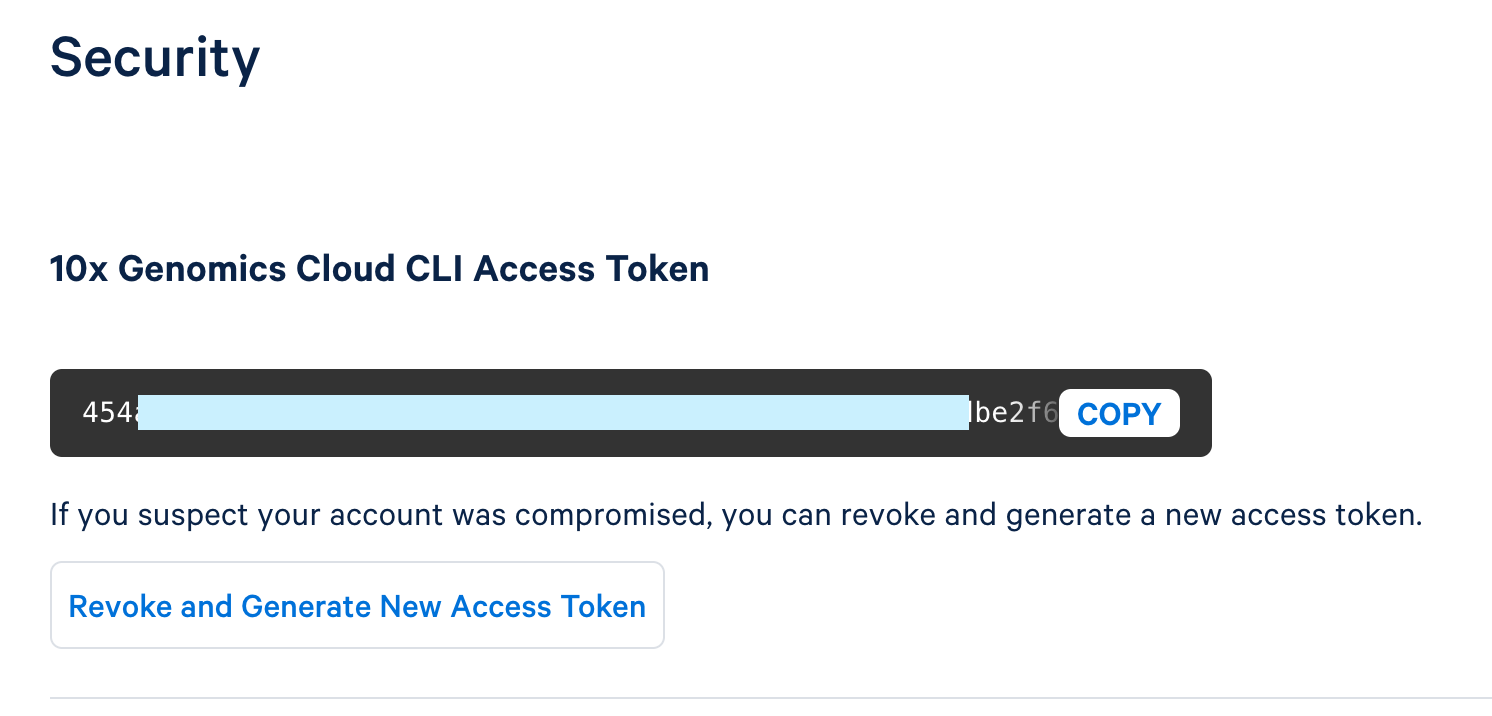
The token is located on the security page of your Cloud Analysis account: https://cloud.10xgenomics.com/account/security.
You have the option to either generate a new token or copy an existing one.

To create a new token, click "Generate New Access Token."
Once the token is generated, use the copy button to copy the entire token and save it as a plain text file in a secure location that others cannot access. This token controls access to data stored in your 10x Cloud Account.
This token file is required as an input with a local installation (i.e., not running in 10x Cloud) to run cellranger annotate, cellranger multi, and cellranger count. When using these pipelines, you will provide a path to the token file via the --tenx-cloud-token-path argument.
The inputs for cellranger annotate are files generated by the cellranger count or cellranger multi pipelines. Therefore, before running cellranger annotate, you must first run either the cellranger count or cellranger multi pipeline.
Specifically, cellranger annotate requires the following files, located in the outs/ directory of a typical cellranger count or cellranger multi run:
- Filtered feature-barcode matrix in H5 format
- Loupe Browser file (
.cloupe) (Optional): If you wantcellranger annotateto generate an annotated.cloupefile as part of the output, you need to include this file as an input. The .cloupe file provides a visual representation of the gene expression data, which can be used in the Loupe Browser to explore the results interactively. If you do not provide a.cloupefile,cellranger annotatewill still run, but it cannot produce an annotated.cloupeoutput.
Visit the command line arguments page for a full list of accepted arguments.
An example command looks like this:
cellranger annotate --id=sample123 \
--matrix=filtered_feature_bc_matrix.h5 \
--cell-annotation-model=auto \
--tenx-cloud-token-path=/path/to/10xcloud_token.json
In this example:
--matrixspecifies the path to the filtered feature-barcode matrix in H5 format.--cell-annotation-modeldetermines the model used for cell type annotation. When set toauto, the pipeline automatically selects the default model.--tenx-cloud-token-pathis the path to the 10x Genomics Cloud Access Token, which is necessary for communication with the cloud-based cell annotation model. If not supplied, will default to the location stored through cellranger cloud auth setup. If the token file does not exit, there is an error.
Cell type annotation generates the same output files, whether run as a standalone command or integrated into the count pipeline. When enabled within the multi pipeline, the annotation summary is embedded into the multi web summary HTML, with no additional web summary HTML generated. All outputs are saved in the outs/ directory.
outs/
├── cell_types
│ ├── cell_annotation_differential_expression.csv
│ ├── cell_annotation_results.json.gz
│ ├── cell_types.csv
│ └── web_summary_cell_types.html
├── web_summary_cell_types.html -> cell_types/web_summary_cell_types.html
| File Name | Description |
|---|---|
web_summary_cell_types.html | View high-level cell types, metrics, and distribution. |
cell_annotation_sample_cloupe.cloupe | The Loupe Browser file from the original analysis, annotated with high-level cell types. |
cell_annotation_results.json.gz | Detailed evidence of how each cell has been assigned a cell type by the algorithm, broken down by dataset IDs in the reference database and nearest-neighbors in each. |
cell_types.csv | A CSV file listing coarse and fine cell types for each cell. |
cell_annotation_differential_expression.csv | Table listing genes differentially expressed in each detected cell type, along with log2 fold-change and associated p-value. |
File Name: web_summary_cell_types.html
Description: A standalone web summary that presents key statistics and visualizations related to the annotation of your sample. This interactive file provides high-level metrics and plots, allowing you to explore the distribution and characteristics of cell types in your dataset.
Key summary visualizations and tables generated from running the annotation pipeline on a publicly available 10x Genomics dataset are described below.
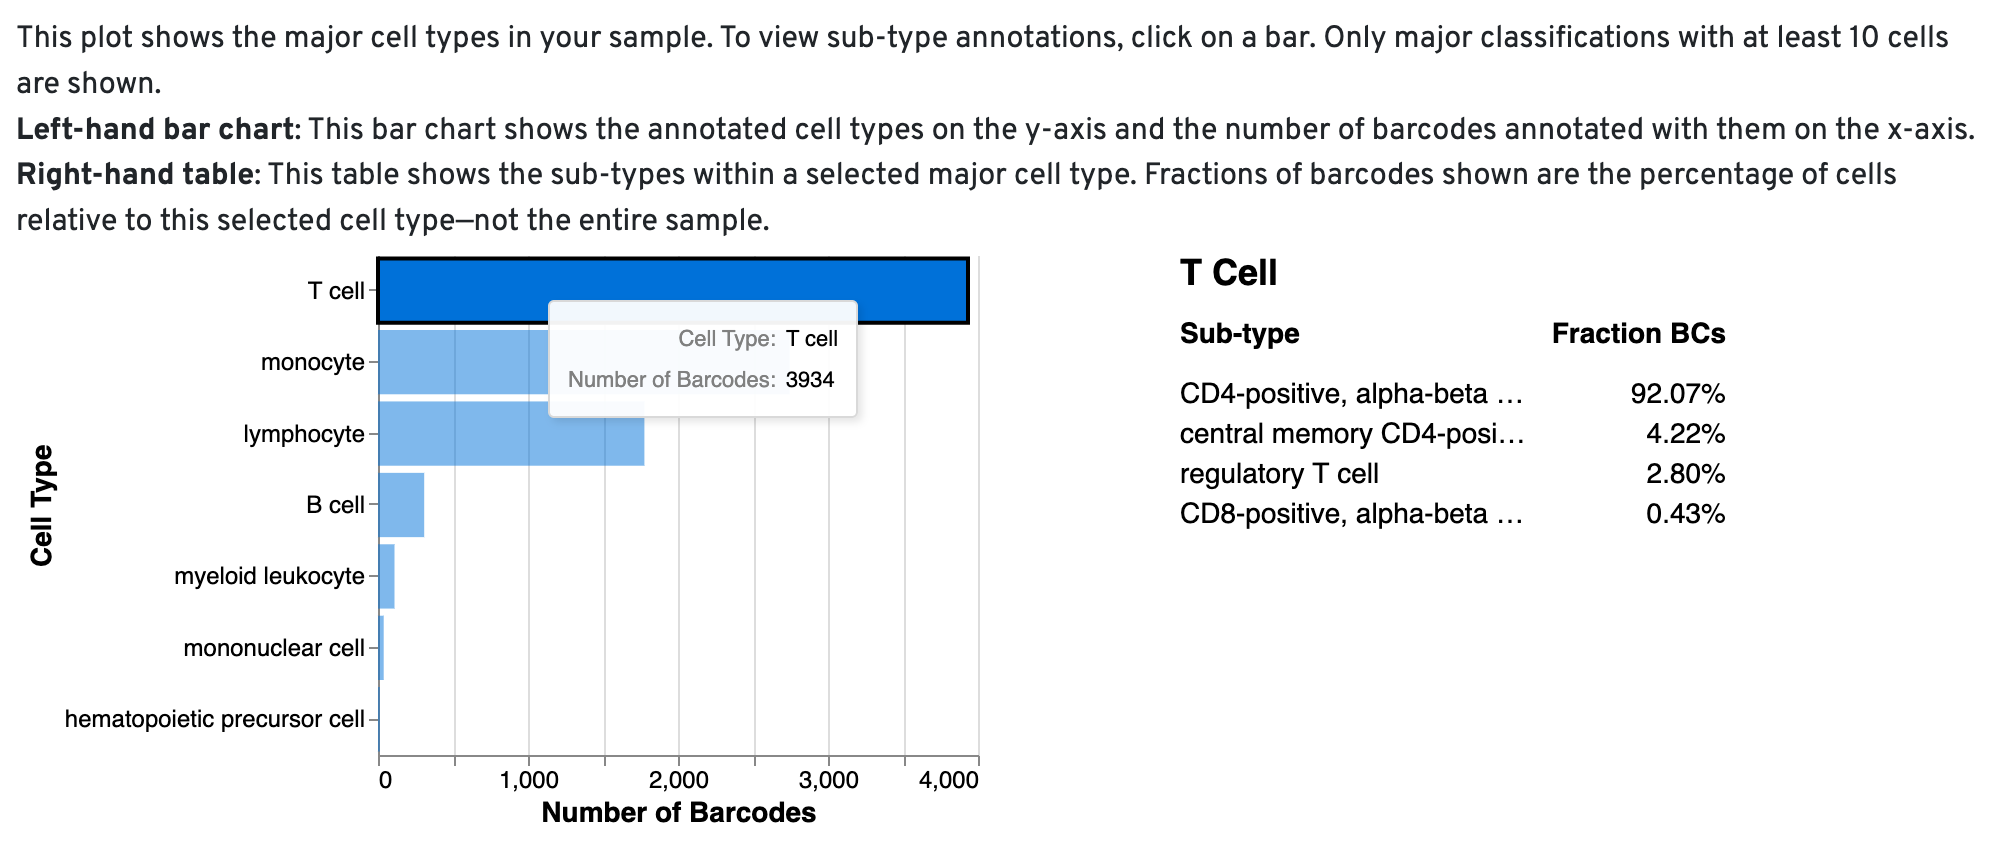
Cell Type Composition Barchart
This chart provides a high-level summary of the cell types present in your sample. By clicking on each bar, you can explore more detailed annotations, revealing the contribution of specific subtypes to the broader cell types. This interactive visualization helps you quickly assess whether the expected cell types are present and suggests potential subtypes within the sample.

When the algorithm is unable to assign a specific cell type to a barcode, it labels the barcode as a "cell." You can review the cell_types CSV file to identify these barcodes marked as 'cells' and manually annotate them using tools like Loupe Browser or other community-developed resources.
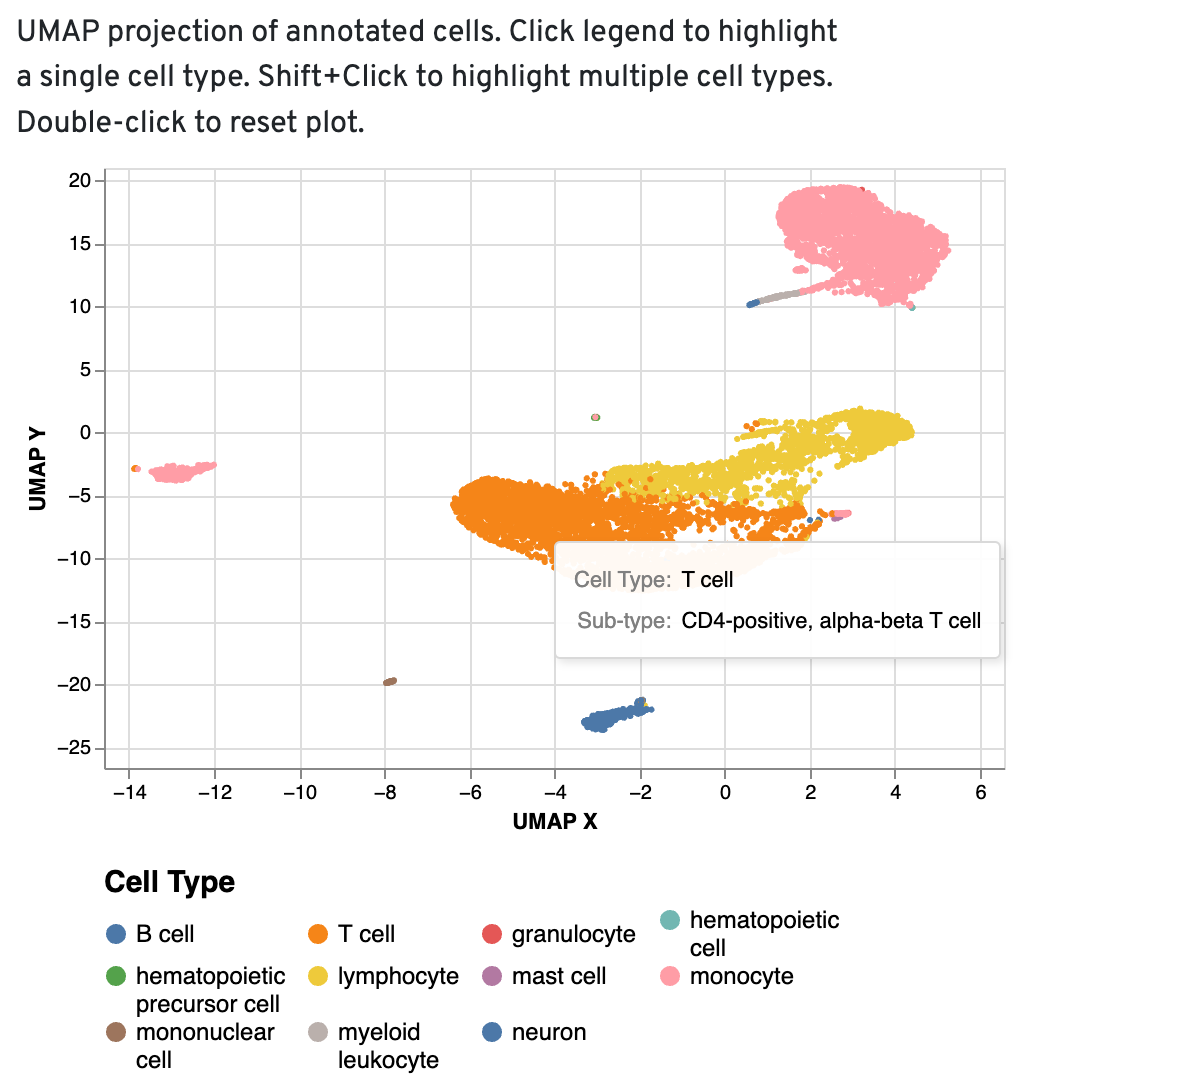
UMAP projections
The UMAP projection of cells is color-coded by the annotated high-level cell type. Distinct cell type populations with relevant cell type labels can be used as a starting point for further annotation in Loupe. If you notice high-level cell types appearing in low numbers or scattered across the UMAP—particularly unexpected cell types—these should be carefully reviewed and potentially re-annotated during further analysis.

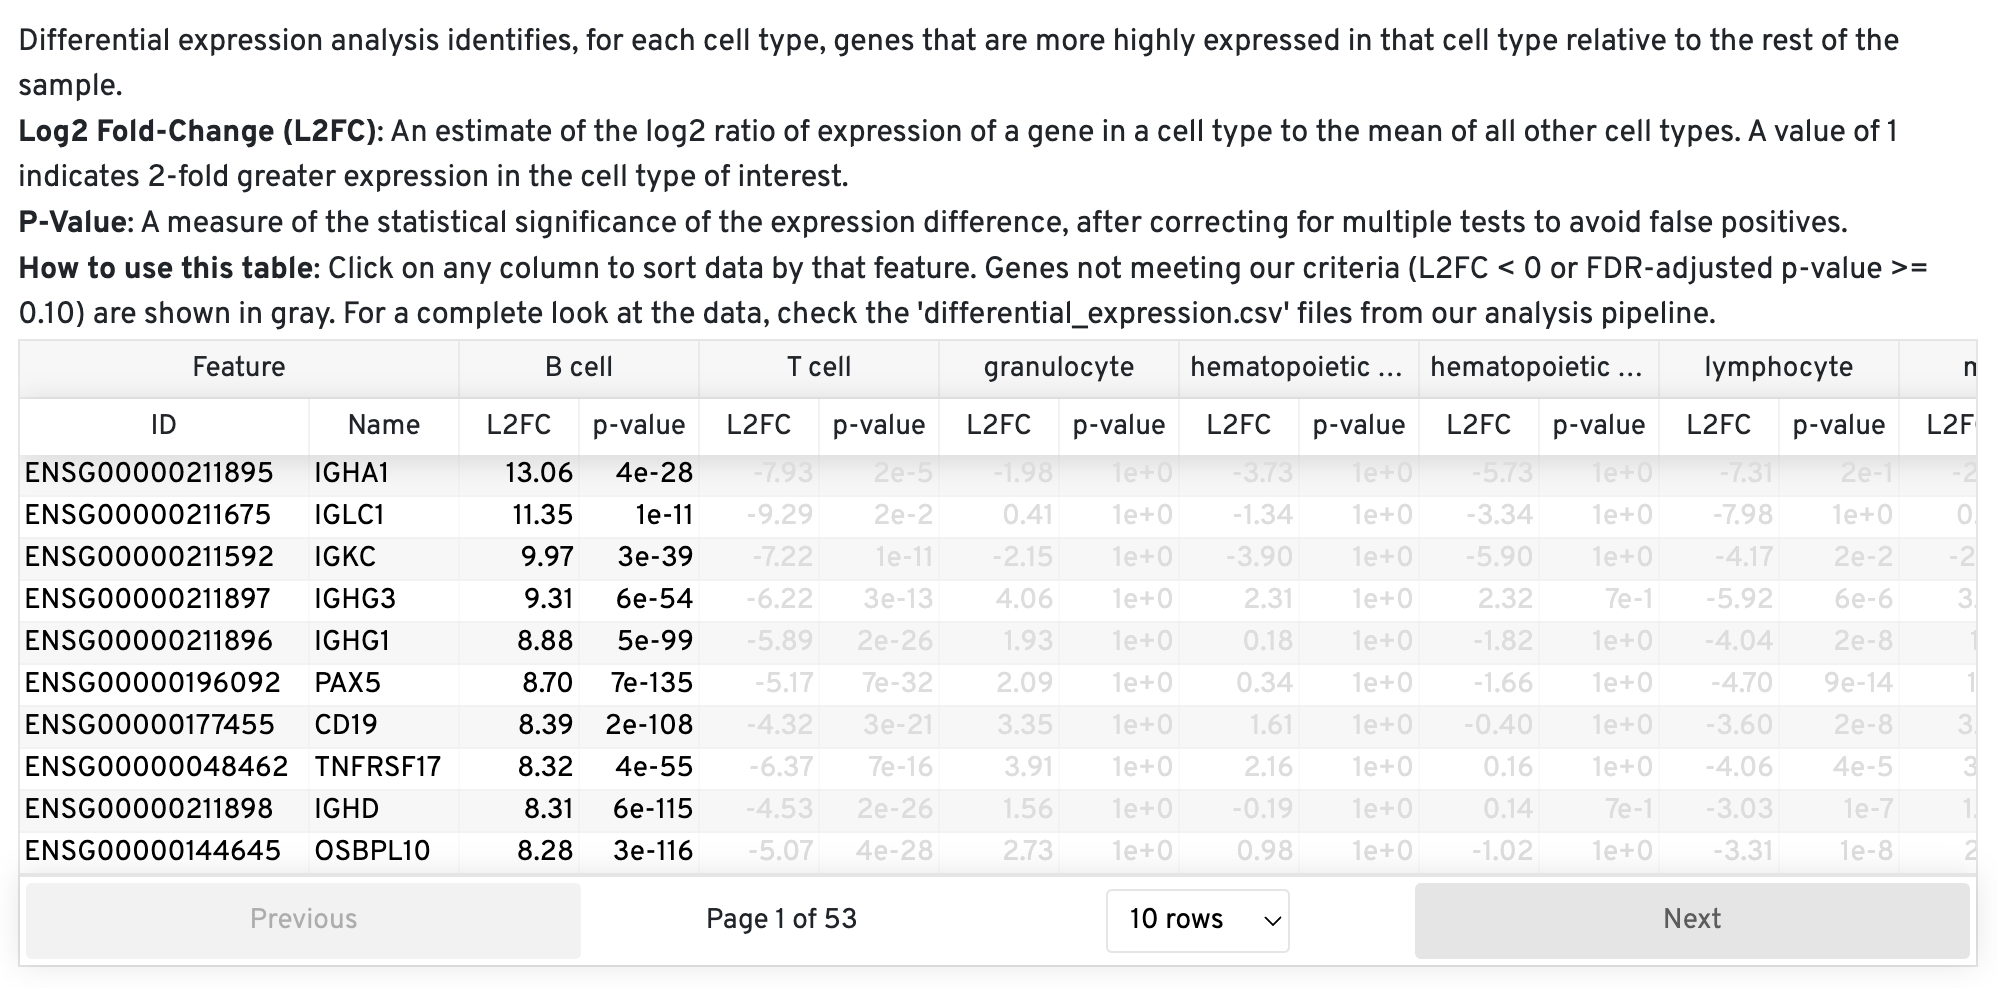
Top Features by Cell Type
This view provides another method for quality control of the annotations. For correctly annotated cells, you should expect to see common marker genes. Mis-annotated cells may show features that are not commonly expressed in that cell type.

File Name: cell_annotation_sample_cloupe.cloupe
Description: A new .cloupe file is generated, which includes coarse cell types in the "Custom Groups" section. By default, this group is labeled "Cell Types," but the name can be customized during the annotation analysis setup.
File Name: cell_annotation_results.json.gz
Description: This file is a compressed JSON containing a list of dictionaries. Each element in the list represents the annotation results from a single barcode, derived from the cell annotation model.
For each barcode, the corresponding dictionary includes the top 500 matches obtained using an approximate-Nearest Neighbor (ANN) lookup. These matches are summarized for the total number of occurrences for a given cell type. While more cells supporting a particular annotation can increase your confidence in the annotation, occasionally the most common nearest-neighbor cell type can have a low number of supporting cells because the nearest-neighbors are split amongst several highly similar cell types (e.g., 'Cd16-Negative, Cd56-Bright Natural Killer Cell, Human' and 'Cd16-Negative, Cd56-Dim Natural Killer Cell'). The dataset_id corresponds to the Chan Zuckerberg CELL by GENE (CZ CELLxGENE) study from which the annotation was derived. To view this study, insert the id into this URL: https://cellxgene.cziscience.com/e/{dataset_id}.cxg/.
An example output is shown below:
{
"barcode": "AAACCAAAGAATGCAA-1",
"matches": [
{
"cell_count_in_model": 32,
"cell_type": "monocyte",
"dataset_ids_with_counts": [
{
"count_per_dataset": 30,
"dataset_id": "87ce26ed-e5d1-44b4-81cc-cc5b709a169f"
},
{
"count_per_dataset": 2,
"dataset_id": "b0e547f0-462b-4f81-b31b-5b0a5d96f537"
}
]
},
File Name: cell_types.csv
Description: This file contains the cell type annotation for each barcode and can be used to import the fine-scale cell type annotations directly into Loupe Browser.
The file contains four columns:
barcode: The cell barcode being annotatedcoarse_cell_type: The high-level annotation of the cell type (e.g., T Cell, B Cell, Neutrophil, etc.). Those coarse cell types are the display nodes we manually curated.fine_cell_type: The original annotation derived from the model based on the most common cell type amongst the 500 nearest-neighbors. Note: This may be the same ascoarse_cell_typeif the original reference was only annotated to that level of detail.cell_count_in_model: The number of cells in the model that support the given fine_cell_type annotation, with a maximum of 500 cells.
An example is shown below:
1 barcode coarse_cell_type fine_cell_type cell_count_in_model
2 AAACCAAAGAATGCAA-1 monocyte CD14-positive monocyte 454
3 AAACCAAAGAGCCGAA-1 monocyte monocyte 217
4 AAACCAAAGCACTCCC-1 T cell "central memory CD4-positive alpha-beta T cell" 370
The number shown for cell_count_in_model reflects the level of support for a cell's annotation. The algorithm identifies the 500 most similar cells in the reference set using embeddings from both the query dataset and the reference database. The cell type assigned is the annotation that appears most frequently among these 500 nearest neighbors. For example, if 400 of the nearest neighbors are labeled as "T cells" and 100 as "lymphocytes,
" the cell will be annotated as a T cell, and the cell_count_in_model will be 400. The maximum possible value for this metric is 500.
This number should be interpreted with caution as an indicator of confidence in the model’s assignment. A high fraction of nearest neighbors supporting a fine-level cell type can suggest greater confidence in the annotation. However, a low value does not necessarily indicate low confidence in the coarse cell type assignment. For example, a T cell coarse-level annotation might be supported by different T cell subtypes, each represented by relatively few cells, but with all 500 nearest neighbors still classified as T cells based on Cell Ontology terms. This nuance highlights two key points: (1) the cell_count_in_model should not be treated as a confidence metric, and (2) there is no threshold that can reliably serve as a confidence cutoff for this number.
File Name: cell_annotation_differential_expression.csv
Description: This file contains the results of a differential expression analysis conducted between coarse cell types. These differentially expressed genes can be used to check that the cell type contains the expected marker genes. The pipeline uses the same algorithm employed in Cell Ranger and Loupe Browser to calculate fold changes and p-values, ensuring consistency within these platforms.