The factors below may contribute to the overall success of add-on custom and standalone custom panel designs and impact downstream data analysis.
The Xenium Onboard Analysis pipeline uses the Xenium codebook to decode transcripts. See the Overview of Xenium Algorithms page to learn about the decoding algorithm.
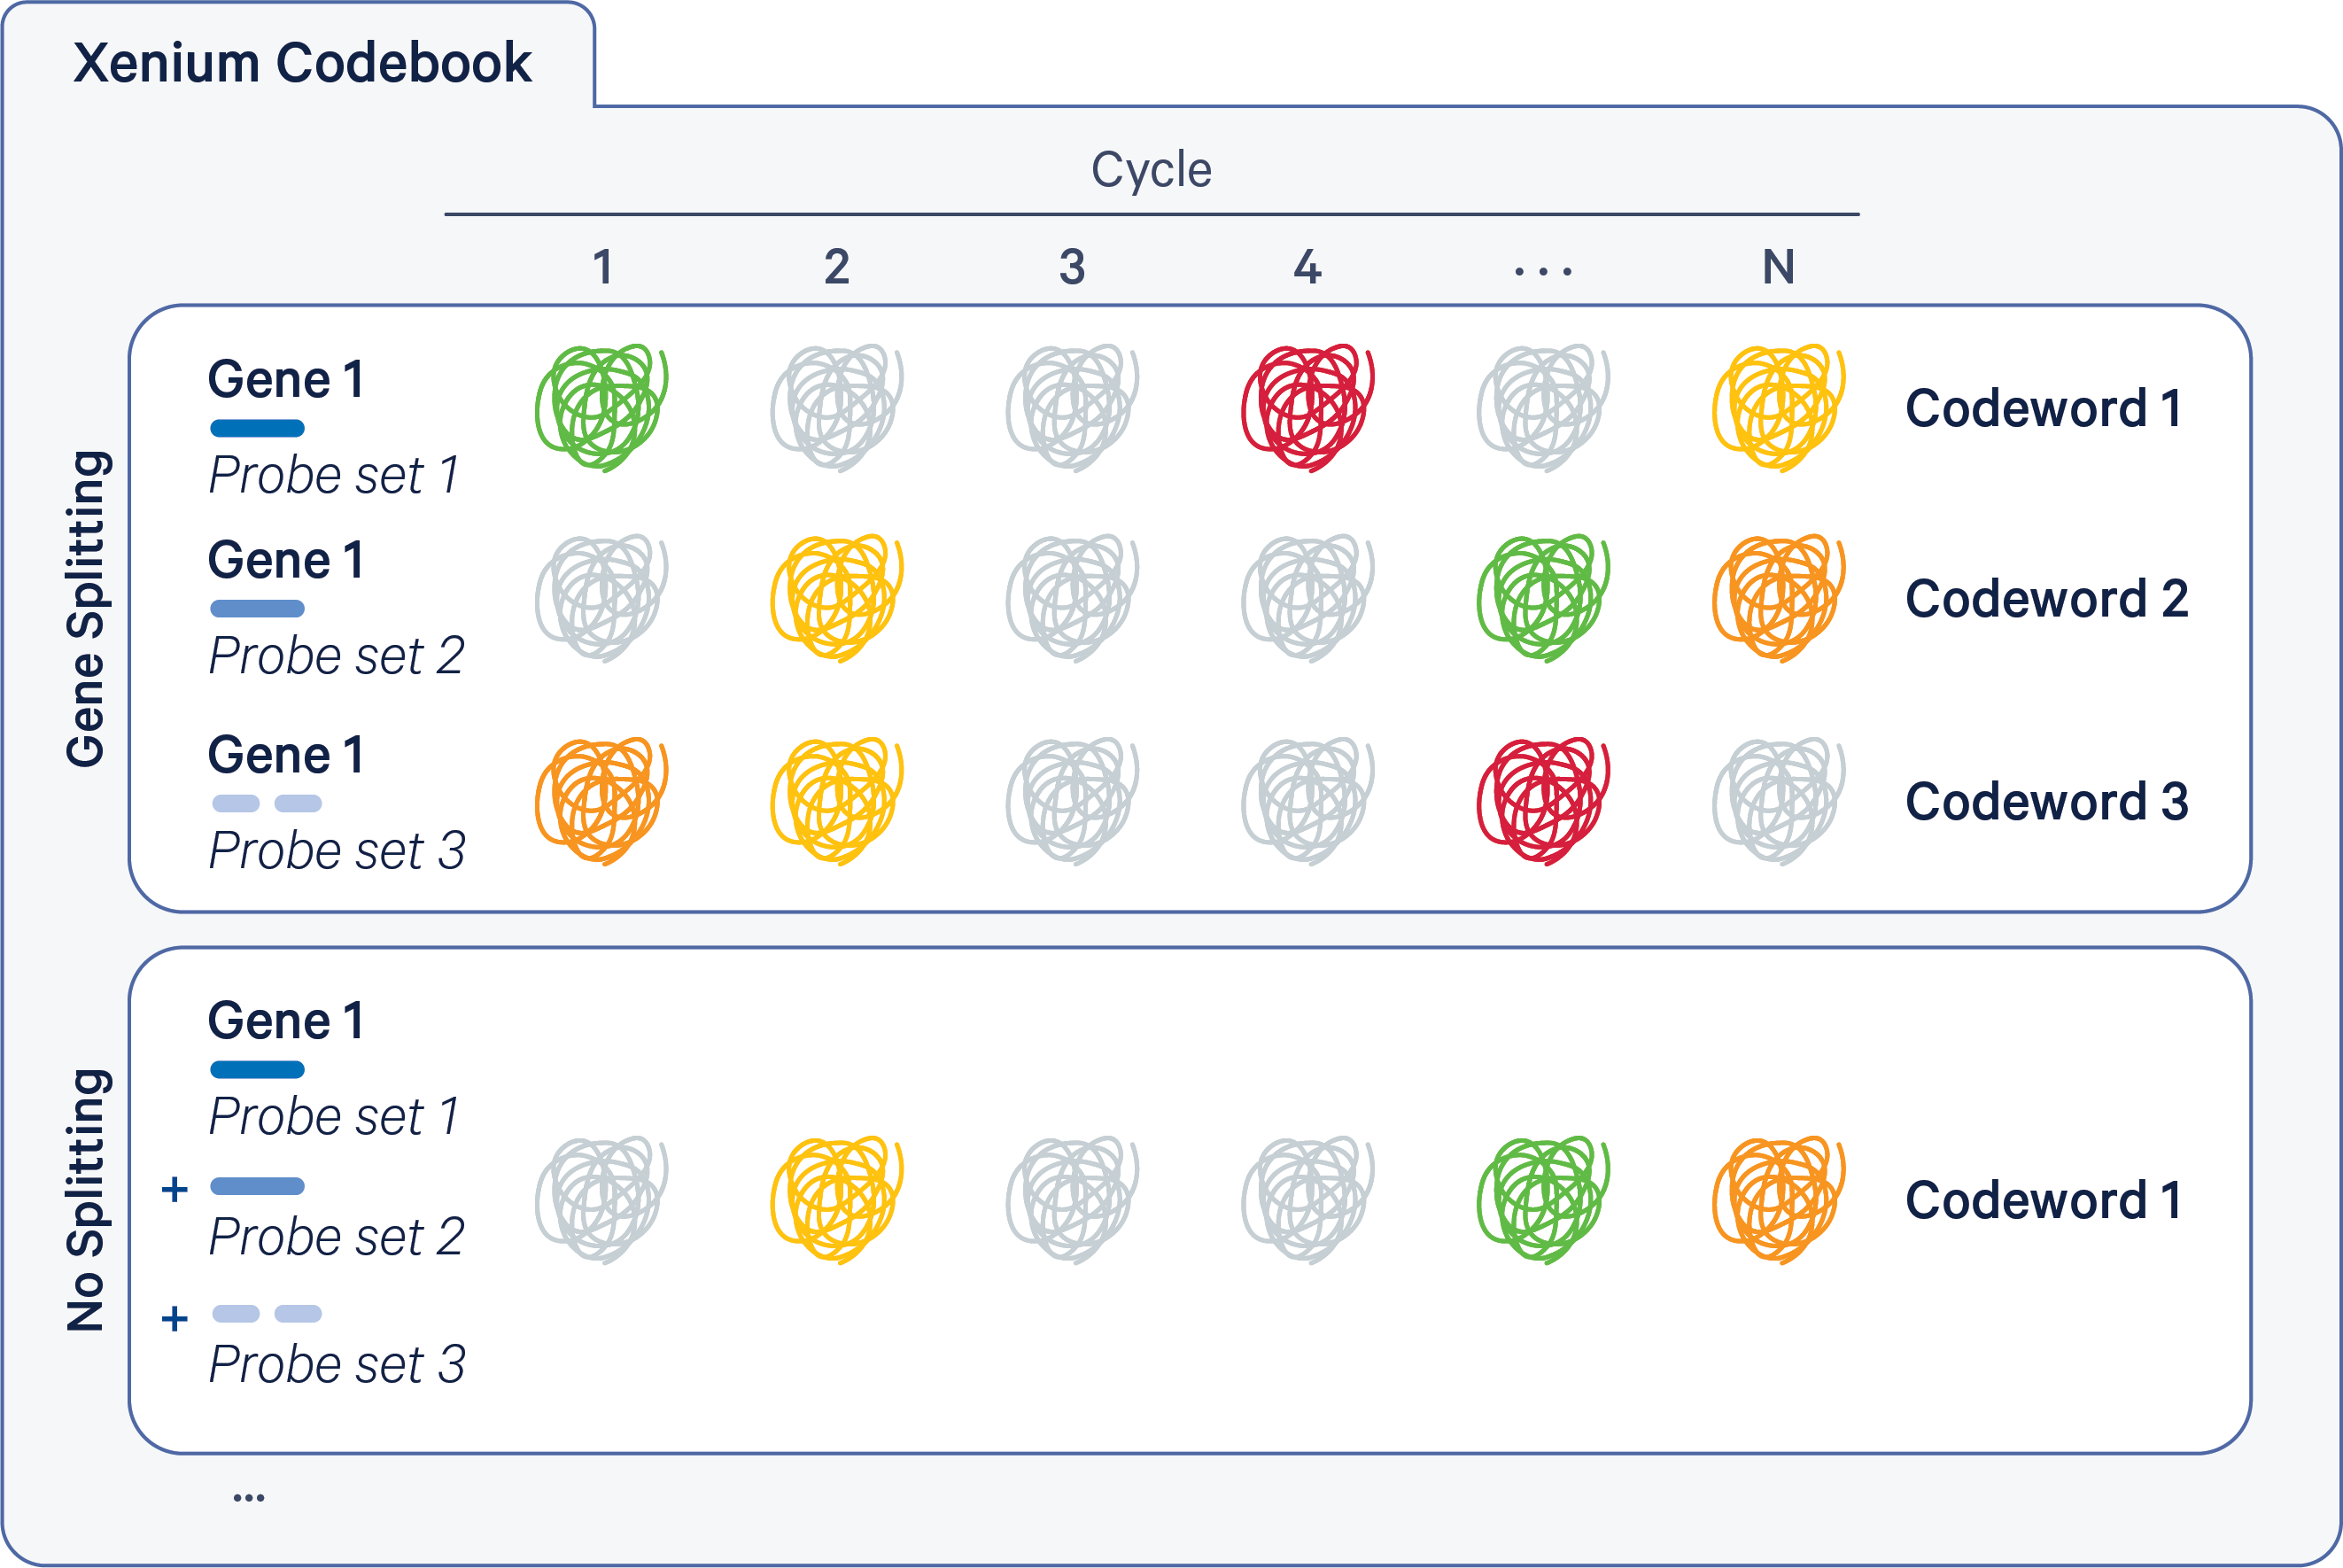
The Xenium codebook contains a collection of codewords that are assigned to genes in a given gene panel. The pipeline uses the gene_panel.json to specify a given gene name to an indexed codeword. Each codeword is defined based on a pattern of fluorescent signal intensities recorded across channels and cycles (see diagram below). Some codewords are reserved for negative controls.
The Xenium codebook can either have a 1 codeword : 1 gene relationship ("no splitting") or a configuration where the signal is split over multiple codewords per gene ("gene splitting"). These modes are illustrated below for an example gene (the probe colors below match those in the probe sets description).
- The top section illustrates gene splitting, where Gene 1 has 3 codewords, with 1 probe set per codeword and 3 probe sets per gene.
- The bottom section illustrates no splitting, where Gene 1 has 1 codeword, with multiple probe sets per codeword (for example, 3 probe sets shown below).
Xenium v1 panels are designed to have 1 codeword per gene, with up to 8 probe sets per gene. There is no gene splitting in Xenium v1 panel designs.
Xenium Prime panels have a gene split design in which multiple codewords are assigned to each gene, with 1 probe set per codeword and ~3 probe sets per gene (but up to 6 and as few as 1).
During the panel generation step for Xenium v1 and Xenium Prime 5K custom panels, the Xenium Panel Designer (XPD) will check for possible cross-ligation events. Cross-ligation events may occur between padlock probes on your custom panel and the relevant pre-designed base panel, if applicable. To screen probes, XPD aligns padlock probe sequences to each other to ensure the custom panel design does not include any probes that may interact.
For example, consider a padlock probe for gene Y whose RNA-binding domains (RBD) have sufficient sequence similarity to the sequence of a padlock probe for gene X. In these cases, the padlock probe may hybridize either to its intended target mRNA sequence or to the padlock probe for gene X (see examples illustrated below). If there is also a match at the ligation junction, this padlock-padlock complex can ligate and become amplified through rolling circle amplification. This scenario would result in false positive detection of gene Y throughout the tissue.

A) An example of a padlock probe binding to its intended RNA target site. B) The probe sequence contains reverse complementary RBD5 and RBD3 sequences on either side of the ligation junction. C) An example of cross-ligation where gene Y’s probe ligates to the backbone sequence of gene X’s probe.
In addition, XPD performs sequence alignment and modeling-based checks during panel generation to minimize the chances of potential off-target signal in the custom panel. As a result, you may notice there is iteration-to-iteration and/or panel-to-panel variability in the total number of usable probe sets per gene. This is an expected part of the panel design process.
Xenium In Situ uses fluorescent microscopy to detect individual transcripts in cells. Like all imaging-based technologies, only a finite number of fluorescent signals can be distinguished within a given area or volume, such as a cell. This means that there is a finite number of transcripts that can be detected in a given tissue volume, which is referred to as a detection budget. As a consequence, panel design involves allocating the available budget in each cell type to a set of carefully selected panel genes.
Gene boosting refers to adding probe sets to any pre-designed gene on a Xenium Prime 5K panel to increase sensitivity (measured as transcripts per cell) for custom add-on panel requests. This may be useful to increase the signal of lowly expressed genes or increase detection of genes with fewer probe sets per gene on the original pre-designed panel. See the Xenium Prime 5K Gene Expression Workflow, Analysis & Data Highlights Technical Note for more information about per-gene sensitivity in the Xenium Prime 5K assay.
For example, say we boost sensitivity by 8 probe sets for a pre-designed panel gene that has 3 probe sets in the Xenium Prime 5K Human Pan Tissue & Pathways Panel. The resulting custom add-on panel will include a new total of 11 probe sets (3 + 8) for this gene.
See this page for more information about modifying probe sets for boosted genes. Gene boosting is not enabled for Xenium v1 chemistry or any standalone or species standalone custom panel requests.
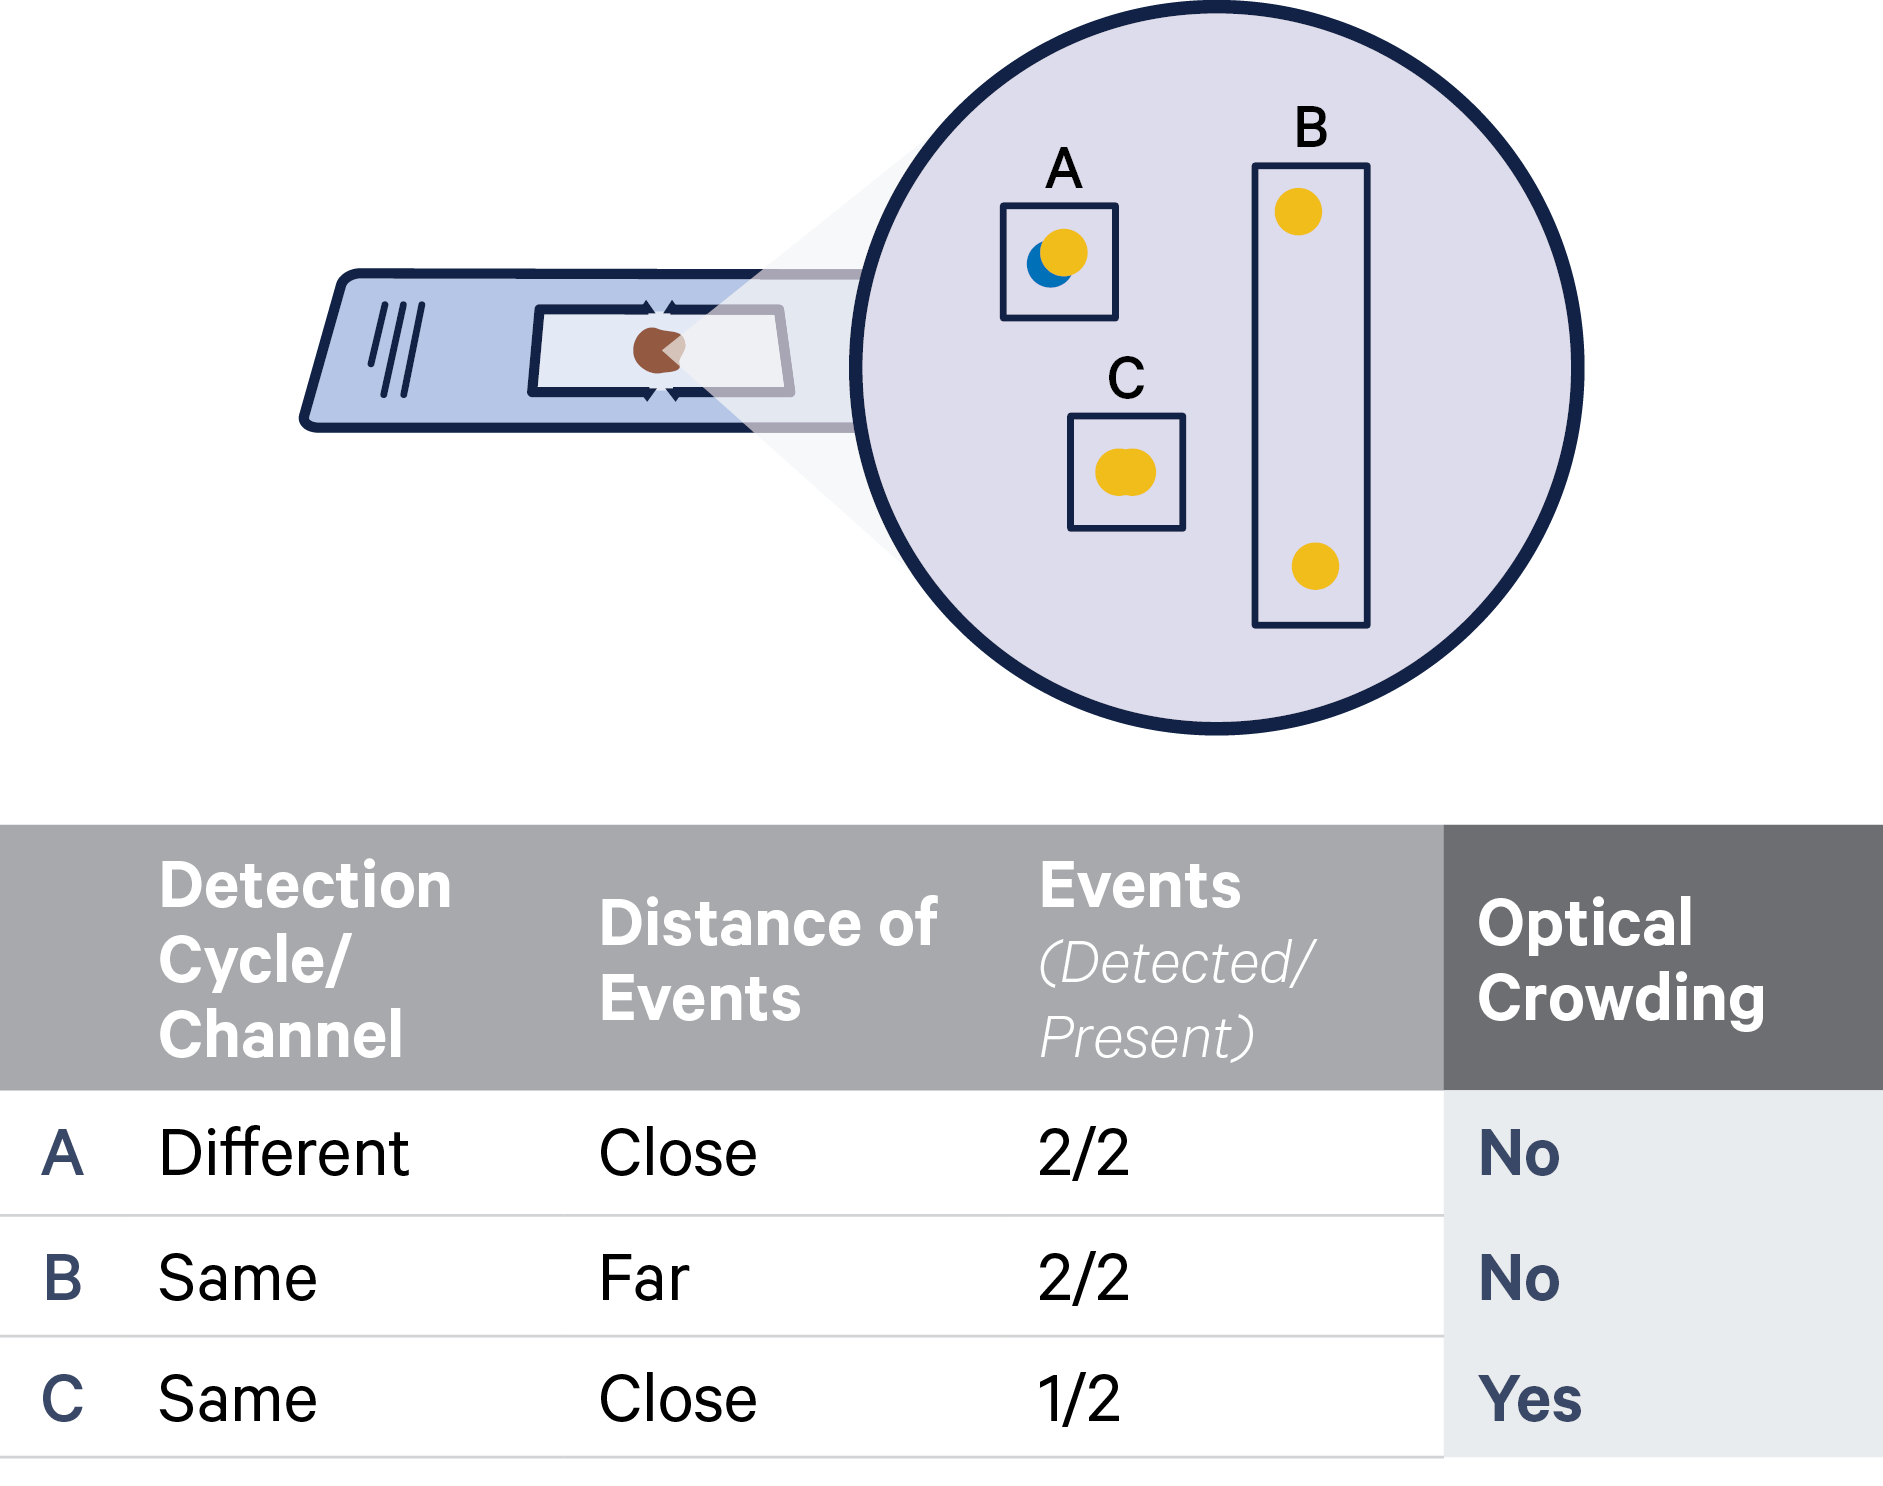
Xenium In Situ was carefully designed to be able to compensate for optical crowding and enable robust transcript detection in most cases. However, in severe cases, the detection sensitivity for a subset of genes on a panel can be impacted significantly. Our custom panel design process is designed to help researchers minimize the risk of severe optical crowding. You can learn more about optical crowding and the ways in which Xenium compensates for this effect in the Xenium Add-on Panel Design Technical Note.
The Xenium chemistry is probe-based. Multiple probes are used per gene in order to successfully capture biological variation (i.e., multiple isoforms). A probe set is a collection of probes designed to detect as many isoforms of a gene as possible based on GENCODE BASIC annotations.
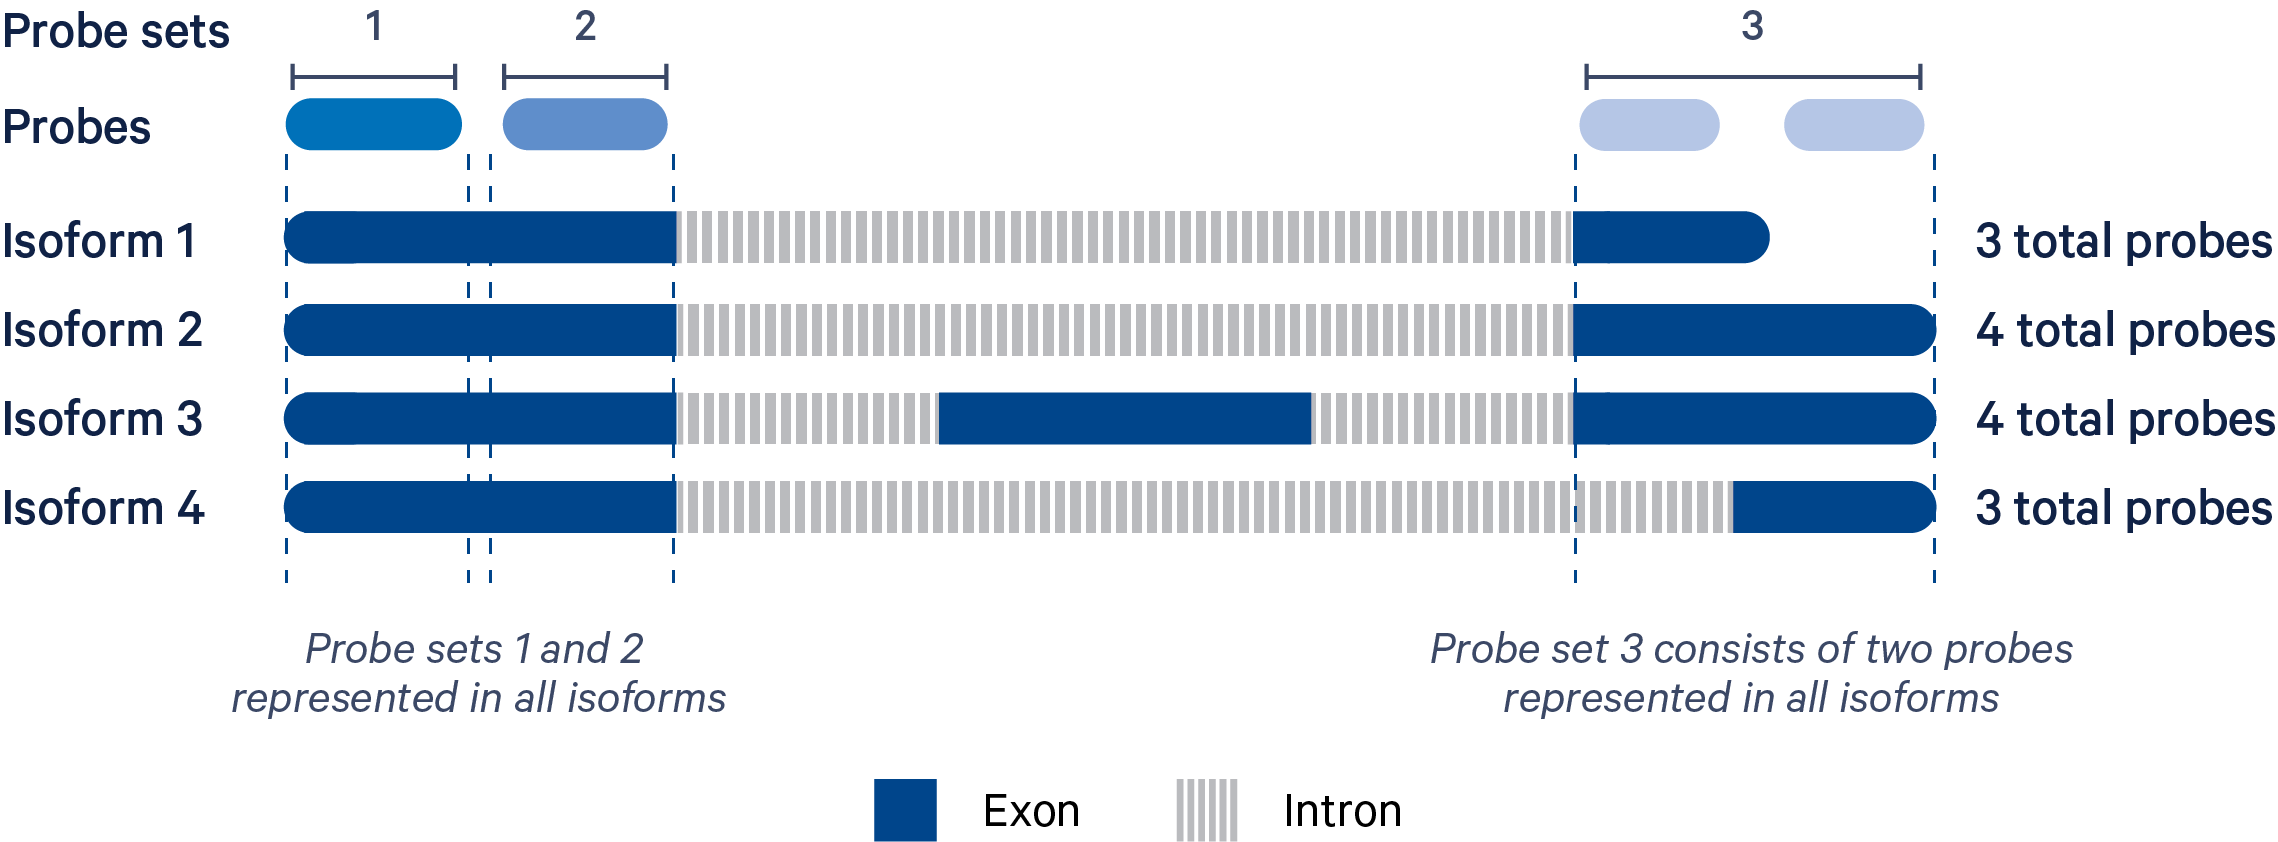
In the example illustrated above, the four isoforms of the gene are targeted by three probe sets. "Probe set 1" and "Probe set 2" each consist of one probe and target four isoforms. "Probe set 3" has two probes because it is not possible to target all four isoforms with a single probe.
Probes should unambiguously bind to the intended target transcript and not to other transcripts. The transcript-complementary regions of the probe must bind specifically to the target sequence within the limits of sample preparation conditions and must enable ligation at the padlock junction and efficient rolling-circle amplification.
It is not always possible to design a single probe that covers every isoform for a gene. This is because some genes have isoforms that do not share sequence, or more often, the sequence they do share is not a good target for probe design. Consequently, some genes in the panel will have probe sets consisting of multiple probes (a probe set is not necessarily a single oligonucleotide). We have pre-designed probe sets for all genes, except for a small fraction of genes for which we were unable to design effective probes. These include:
- Genes with high sequence homology to paralogs (e.g., genes with zinc-finger motifs) are not amenable to specific probe design because they lack a unique target sequence.
- Factors like extreme GC-content can also limit our ability to design effective probes for a given gene.
Based on the above limitations, some genes may have as few as one probe set. Generally, genes with at least three probe sets have robust detection, while those with one or two probe sets run the risk of not being detected. In the panel design process, we may include fewer than the default number of probe sets for a gene if it is very highly expressed to maximize the optical budget efficiency. A reduction in probe sets for a given gene results in an approximately linear decrease in sensitivity. For example, the detection efficiency for a given gene decreases by ~50% if probe sets are reduced from eight to four.
In Xenium panel designs, the FASTA file contains the panel probe sequences in FASTA format, as represented on the probes and reverse-complement to the targeted transcript in FASTA format. The sequence ID consists of the transcript ID, gene name, and a unique identifying string, e.g. ENSG00000134440|NARS|1f419e5.
In Xenium panel designs, the 13 column BED detail file contains the sequences and genomic coordinates of the probes. For a description of each column in this file, please see BED format specs. For the entry name (column 4), we format it as {GENE SYMBOL} ({ENSEMBL ID}) | {CODEWORD} | {INDEX}. The codeword, as well as the probe set group the entry is in, are also tabulated in column 13. The underlying genomic references are GRCh38 for human and GRCm38 for mouse.
This file may be used to visualize the probe locations with genome browsers like IGV (Integrated Genomics Viewer) and the UCSC Genome Browser, or to intersect the probe locations with other genomic features of interest using tools like bedtools.
The BED file information is useful for determining whether probes span exon-exon junctions. For example, probe ENSG00000134440|NARS|1f419e5, has the following sequence:
>ENSG00000134440|NARS|1f419e5
TCCTTCTAACGCACCAATCTTCACACATTTTGGCTCTGGG
And its BED record shows the coordinates in the top row below:
chr18 57613656 57615656 NARS (ENSG00000134440) | 168 | 7 0 + 57613656 57615656 35,23,27 2 24,16 0,1984 Codeword: 168, Probeset: 1
Loading the BED file in IGV shows this probe spans two exons: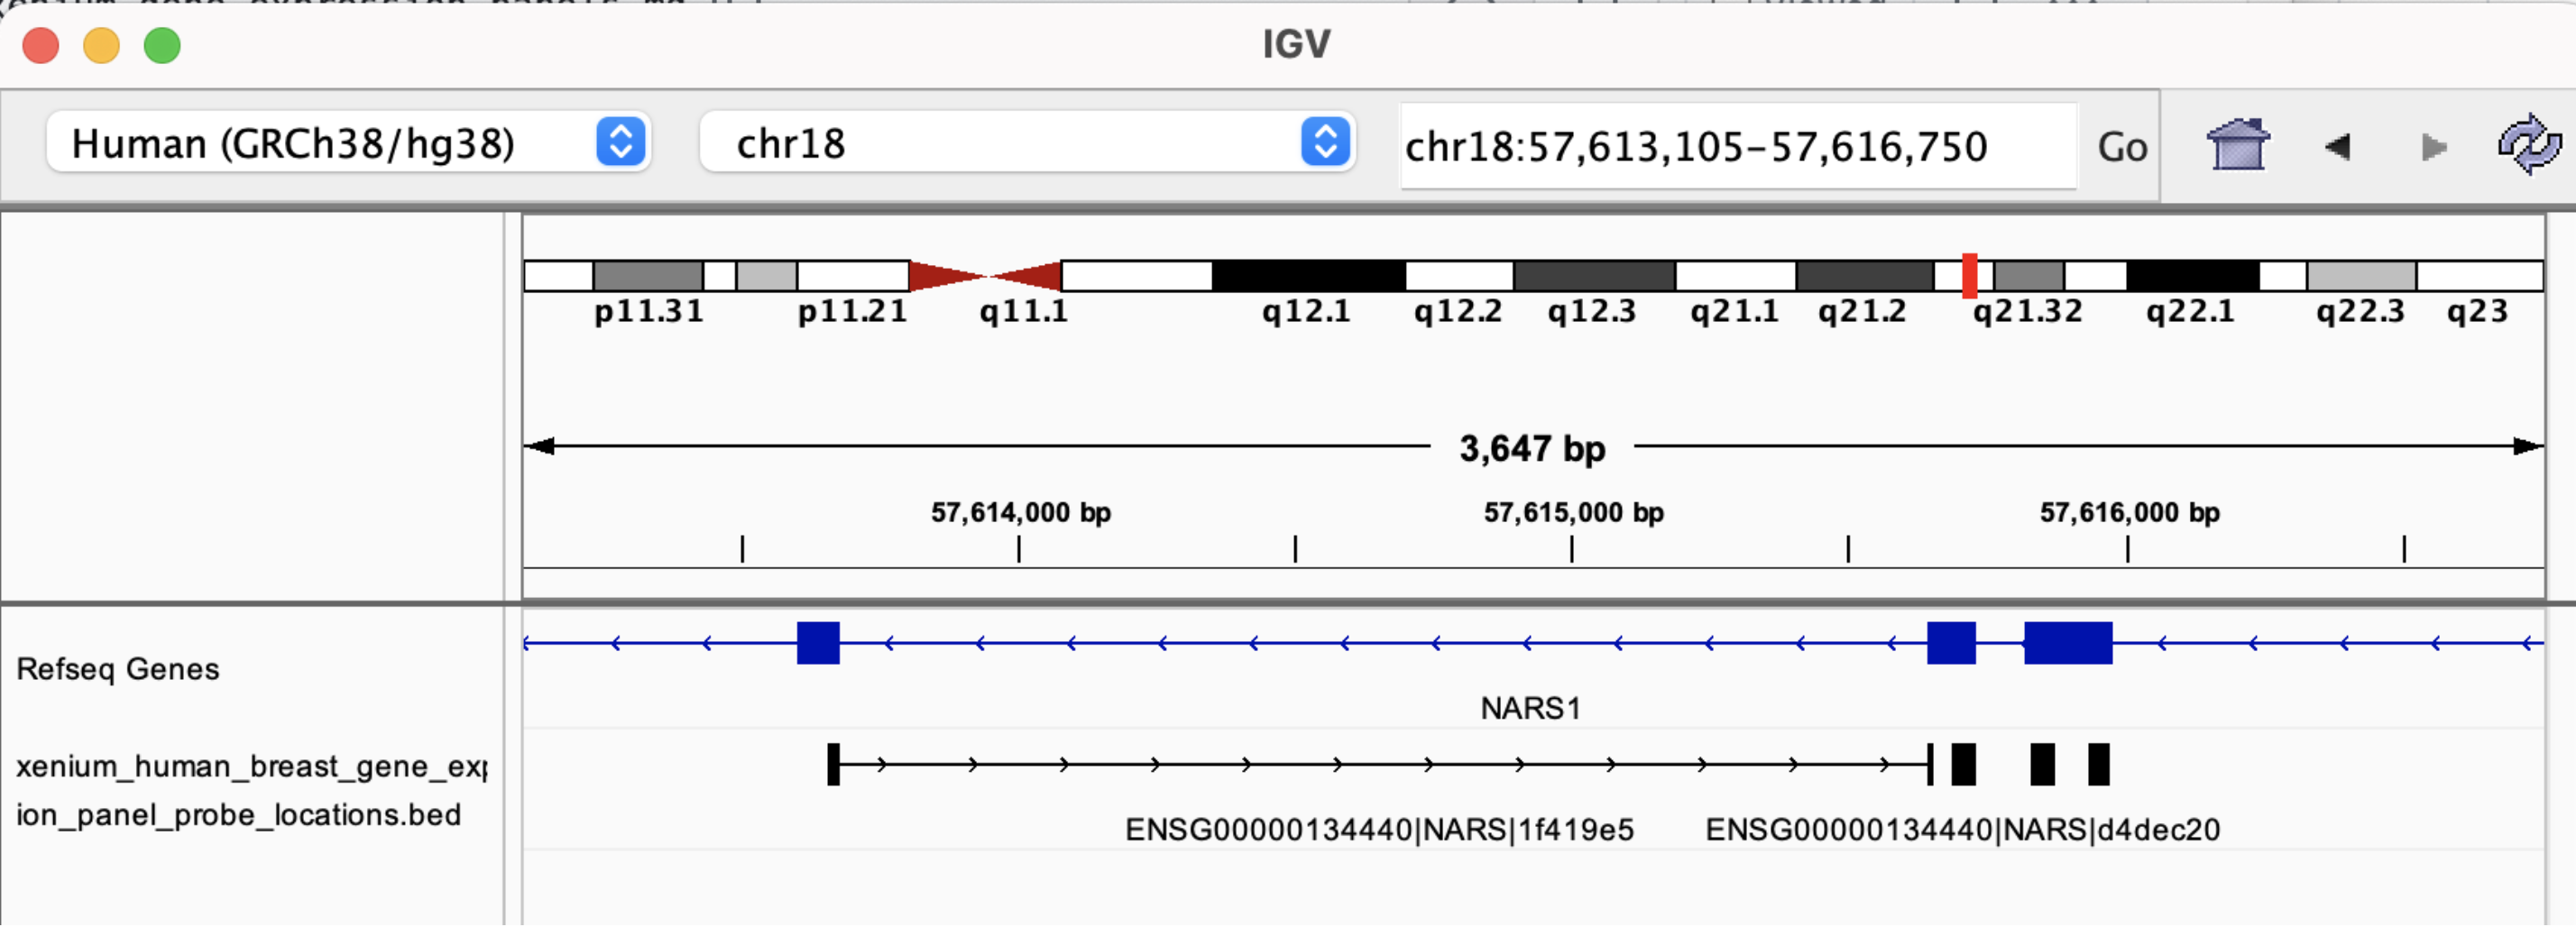
By zooming in, we see the probe sequence as represented in the FASTA file is the reverse-complement of the transcript sequence: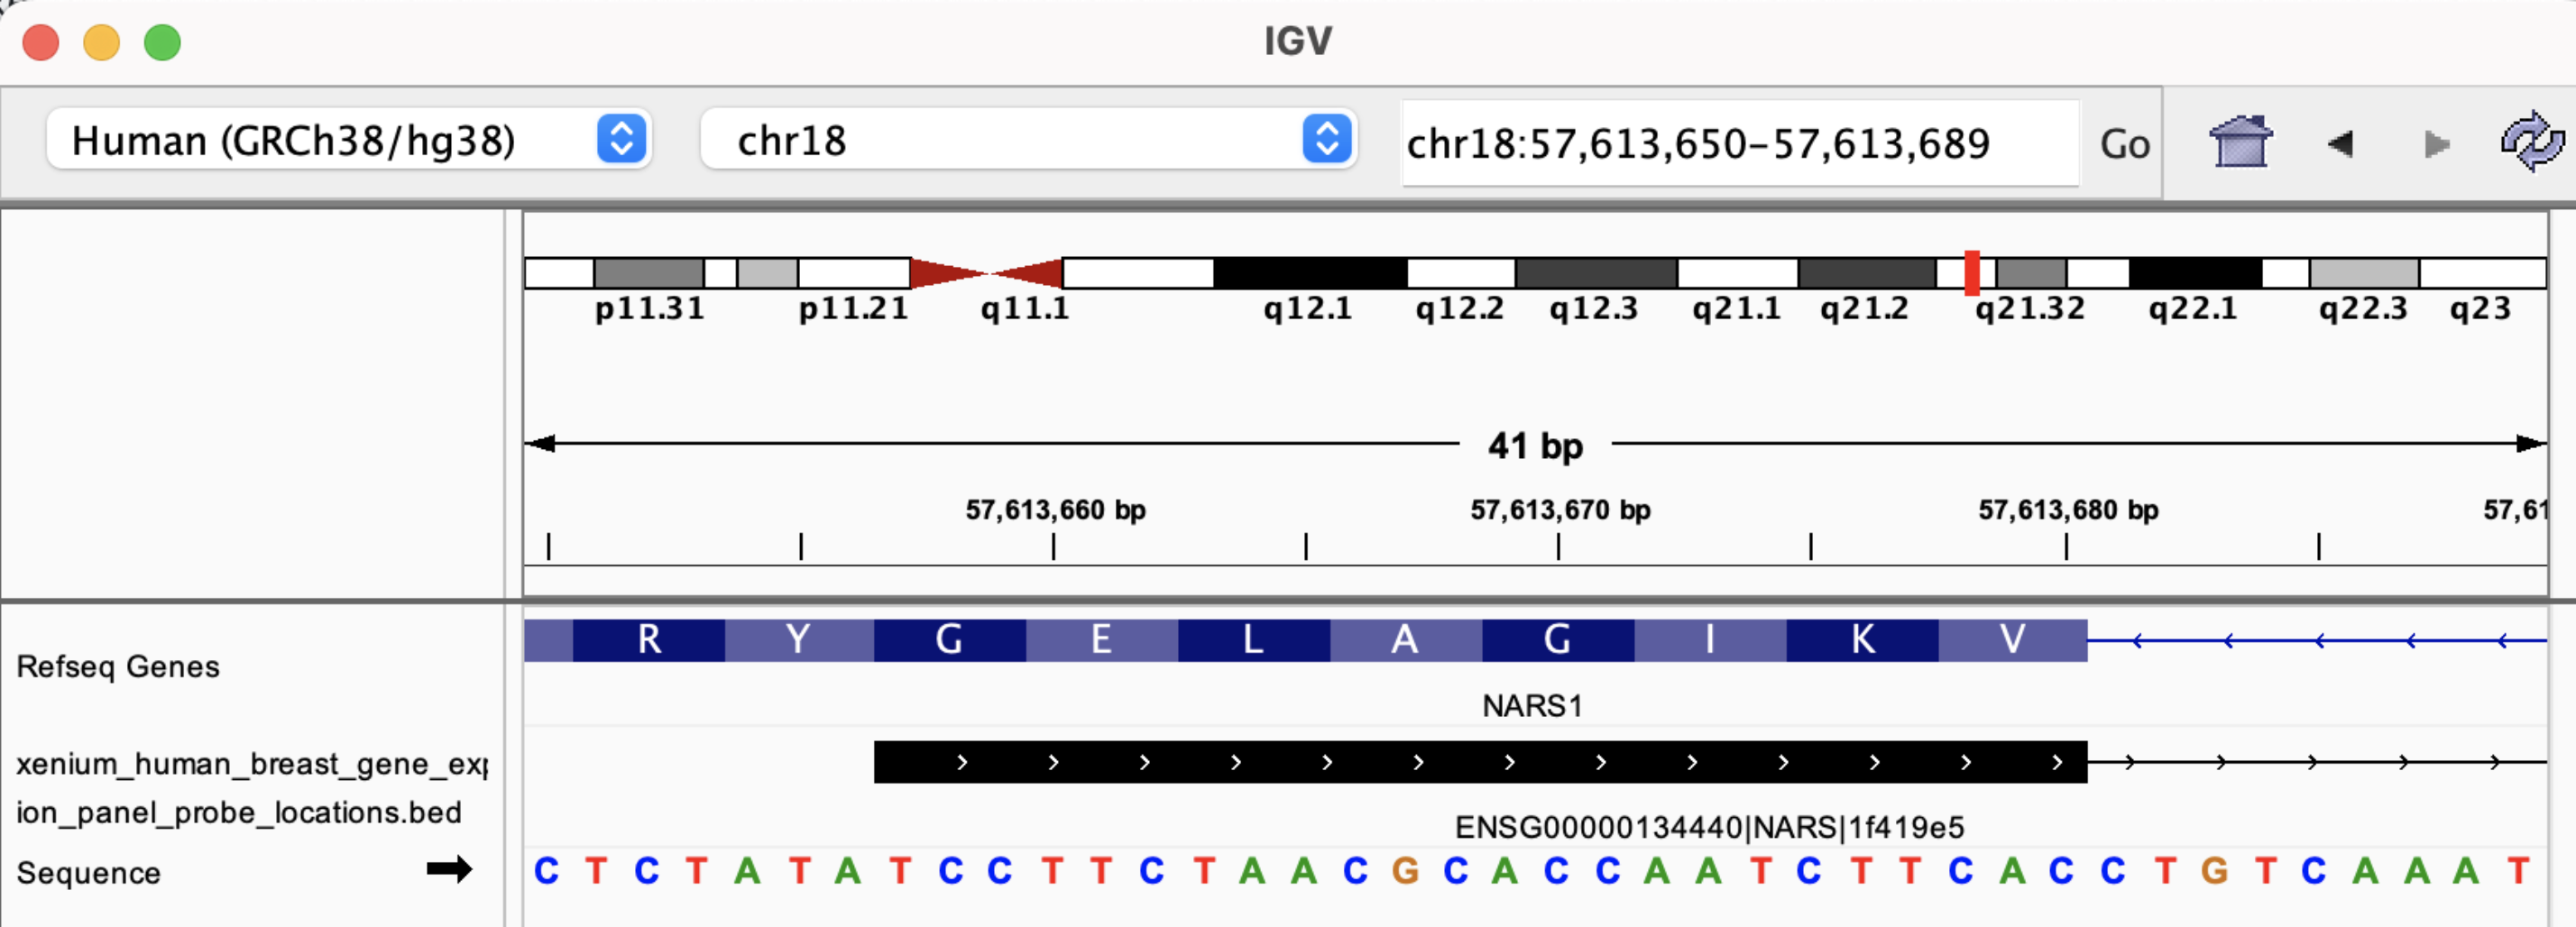
Sensitivity refers to the fraction of transcripts detected per cell, i.e. the ratio between the number of transcripts observed and the number of transcripts actually present in the cell. Since it is usually not possible to know the true number of transcripts present, it is typically difficult to quantify sensitivity in absolute terms.
Like other single cell technologies (e.g., Chromium Single Cell 3’ Gene Expression and Chromium Single Cell Gene Expression Flex), Xenium in situ data analysis does not detect every transcript of a given gene present in a cell. Cell-by-cell variation in the fraction of transcripts detected manifests as technical variation (noise) in the number of observed transcript counts per cell.
For a given cell type, utilization describes the fraction of a cell's transcriptome that a Xenium Gene Expression panel is targeting. It is measured in units of "TP10K" (transcripts per 10,000).
Higher utilization values can indicate higher predictions of transcript density for cells belonging to a given cell type.
To calculate utilization per gene (measured in units of TP10K) from single cell data, we first calculate the mean expression of each gene in all cells labeled with a given cell type and then scale the resulting profile so it sums to 10,000. This is done by dividing all values of the profile by the total sum and multiplying by 10,000. To calculate utilization of the panel, we sum the TP10K values for all genes on the panel.
This method is similar to how bulk RNA-seq expression profiles are calculated, sometimes in units of "TPM" (transcripts per million). Here, we scale to 10,000 in order to obtain relative values that are closer to the absolute number of transcripts observed.