Resources:
最大化您的见解
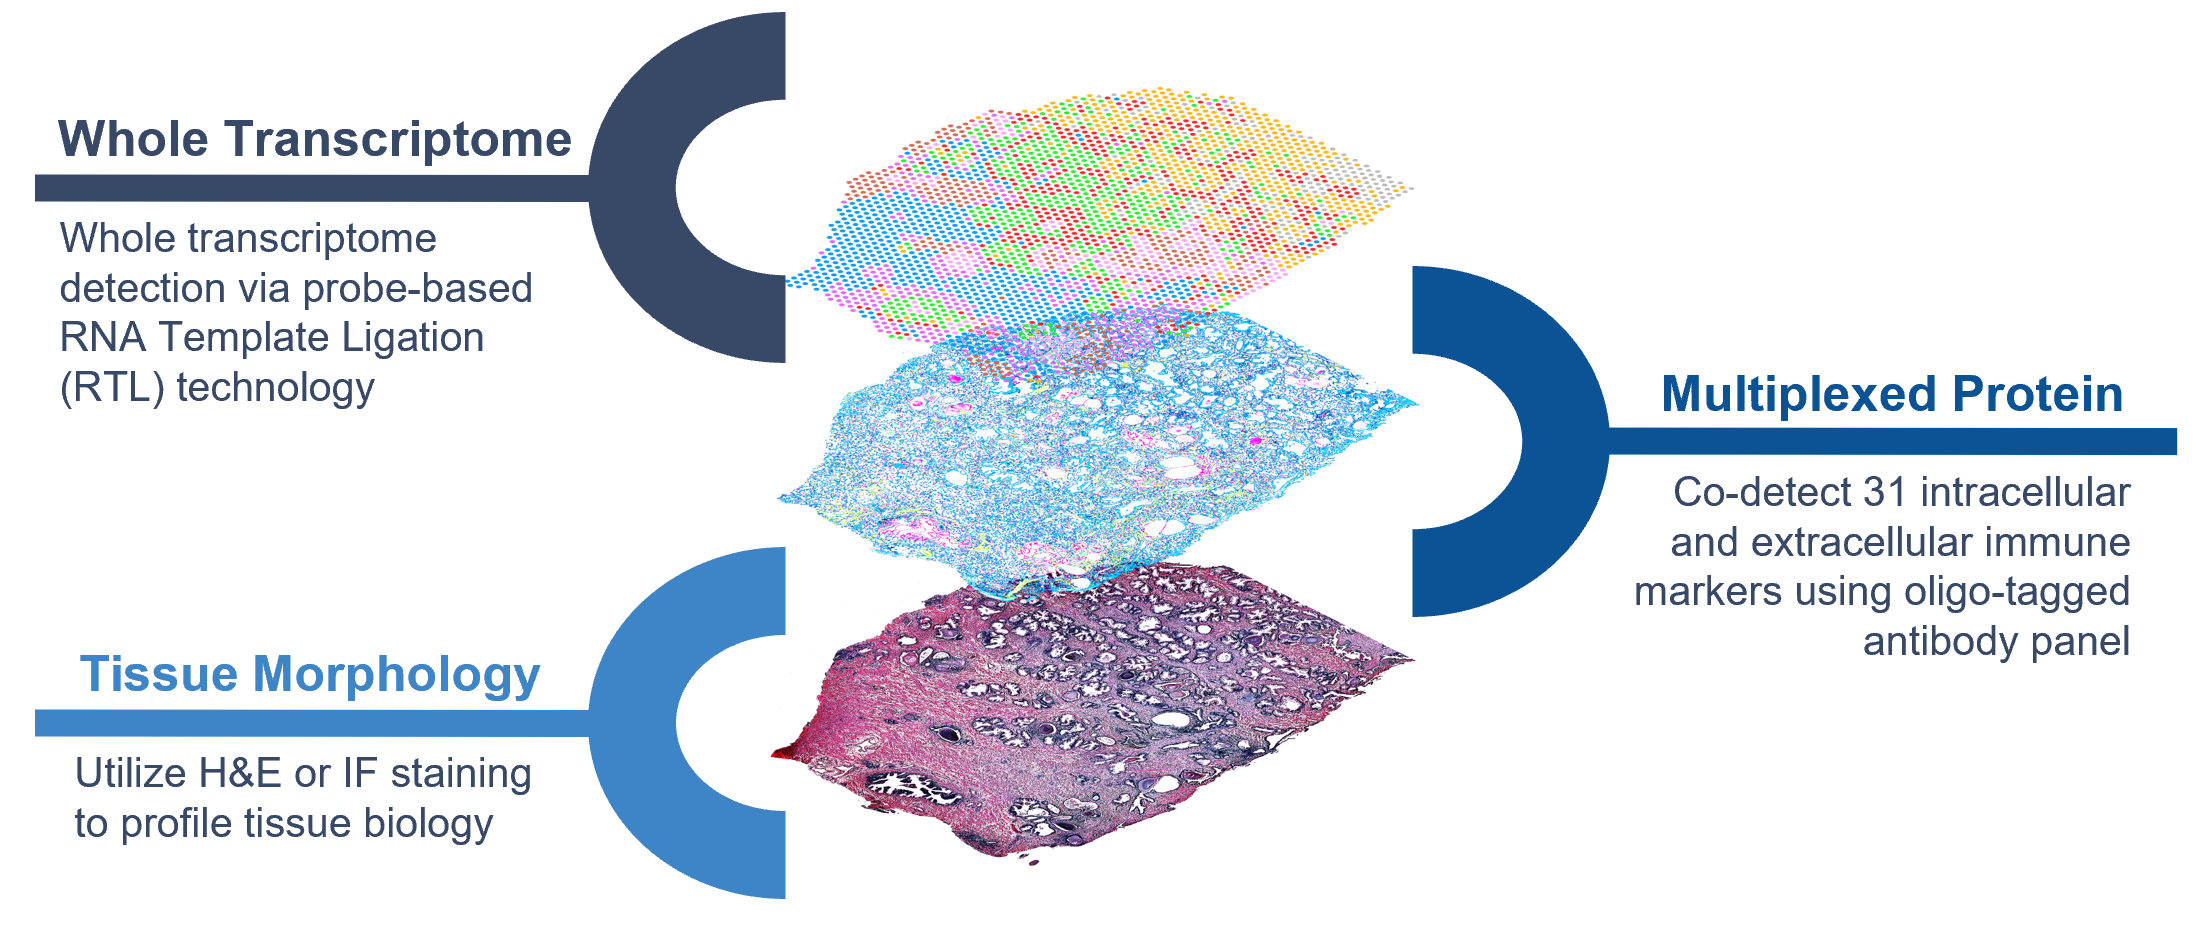
通过分析同一张组织切片中的蛋白质、mRNA和形态学对您的样本进行更深入、更全面地评估。
分析整张组织切片
观察蛋白质表达和全转录组表达,无需选择感兴趣的区域。
简化数据分析
通过易用的软件将蛋白质检测图谱与基因表达数据相结合。
探索您的应用
全面了解疾病复杂性
发现新的生物标志物,鉴定新的细胞类型和状态
绘制细胞图谱的空间结构
确定基因的时空表达模式
Technology Highlight
- Dozens of protein markers + whole transcriptome RNA mapped to the pristine morphology of a single tissue section
- Detect intracellular + extracellular proteins and gain deeper biological insights
- 10x pre-validated antibody panels lets labs hit the ground running w/ minimal assay development
Visualization Controls
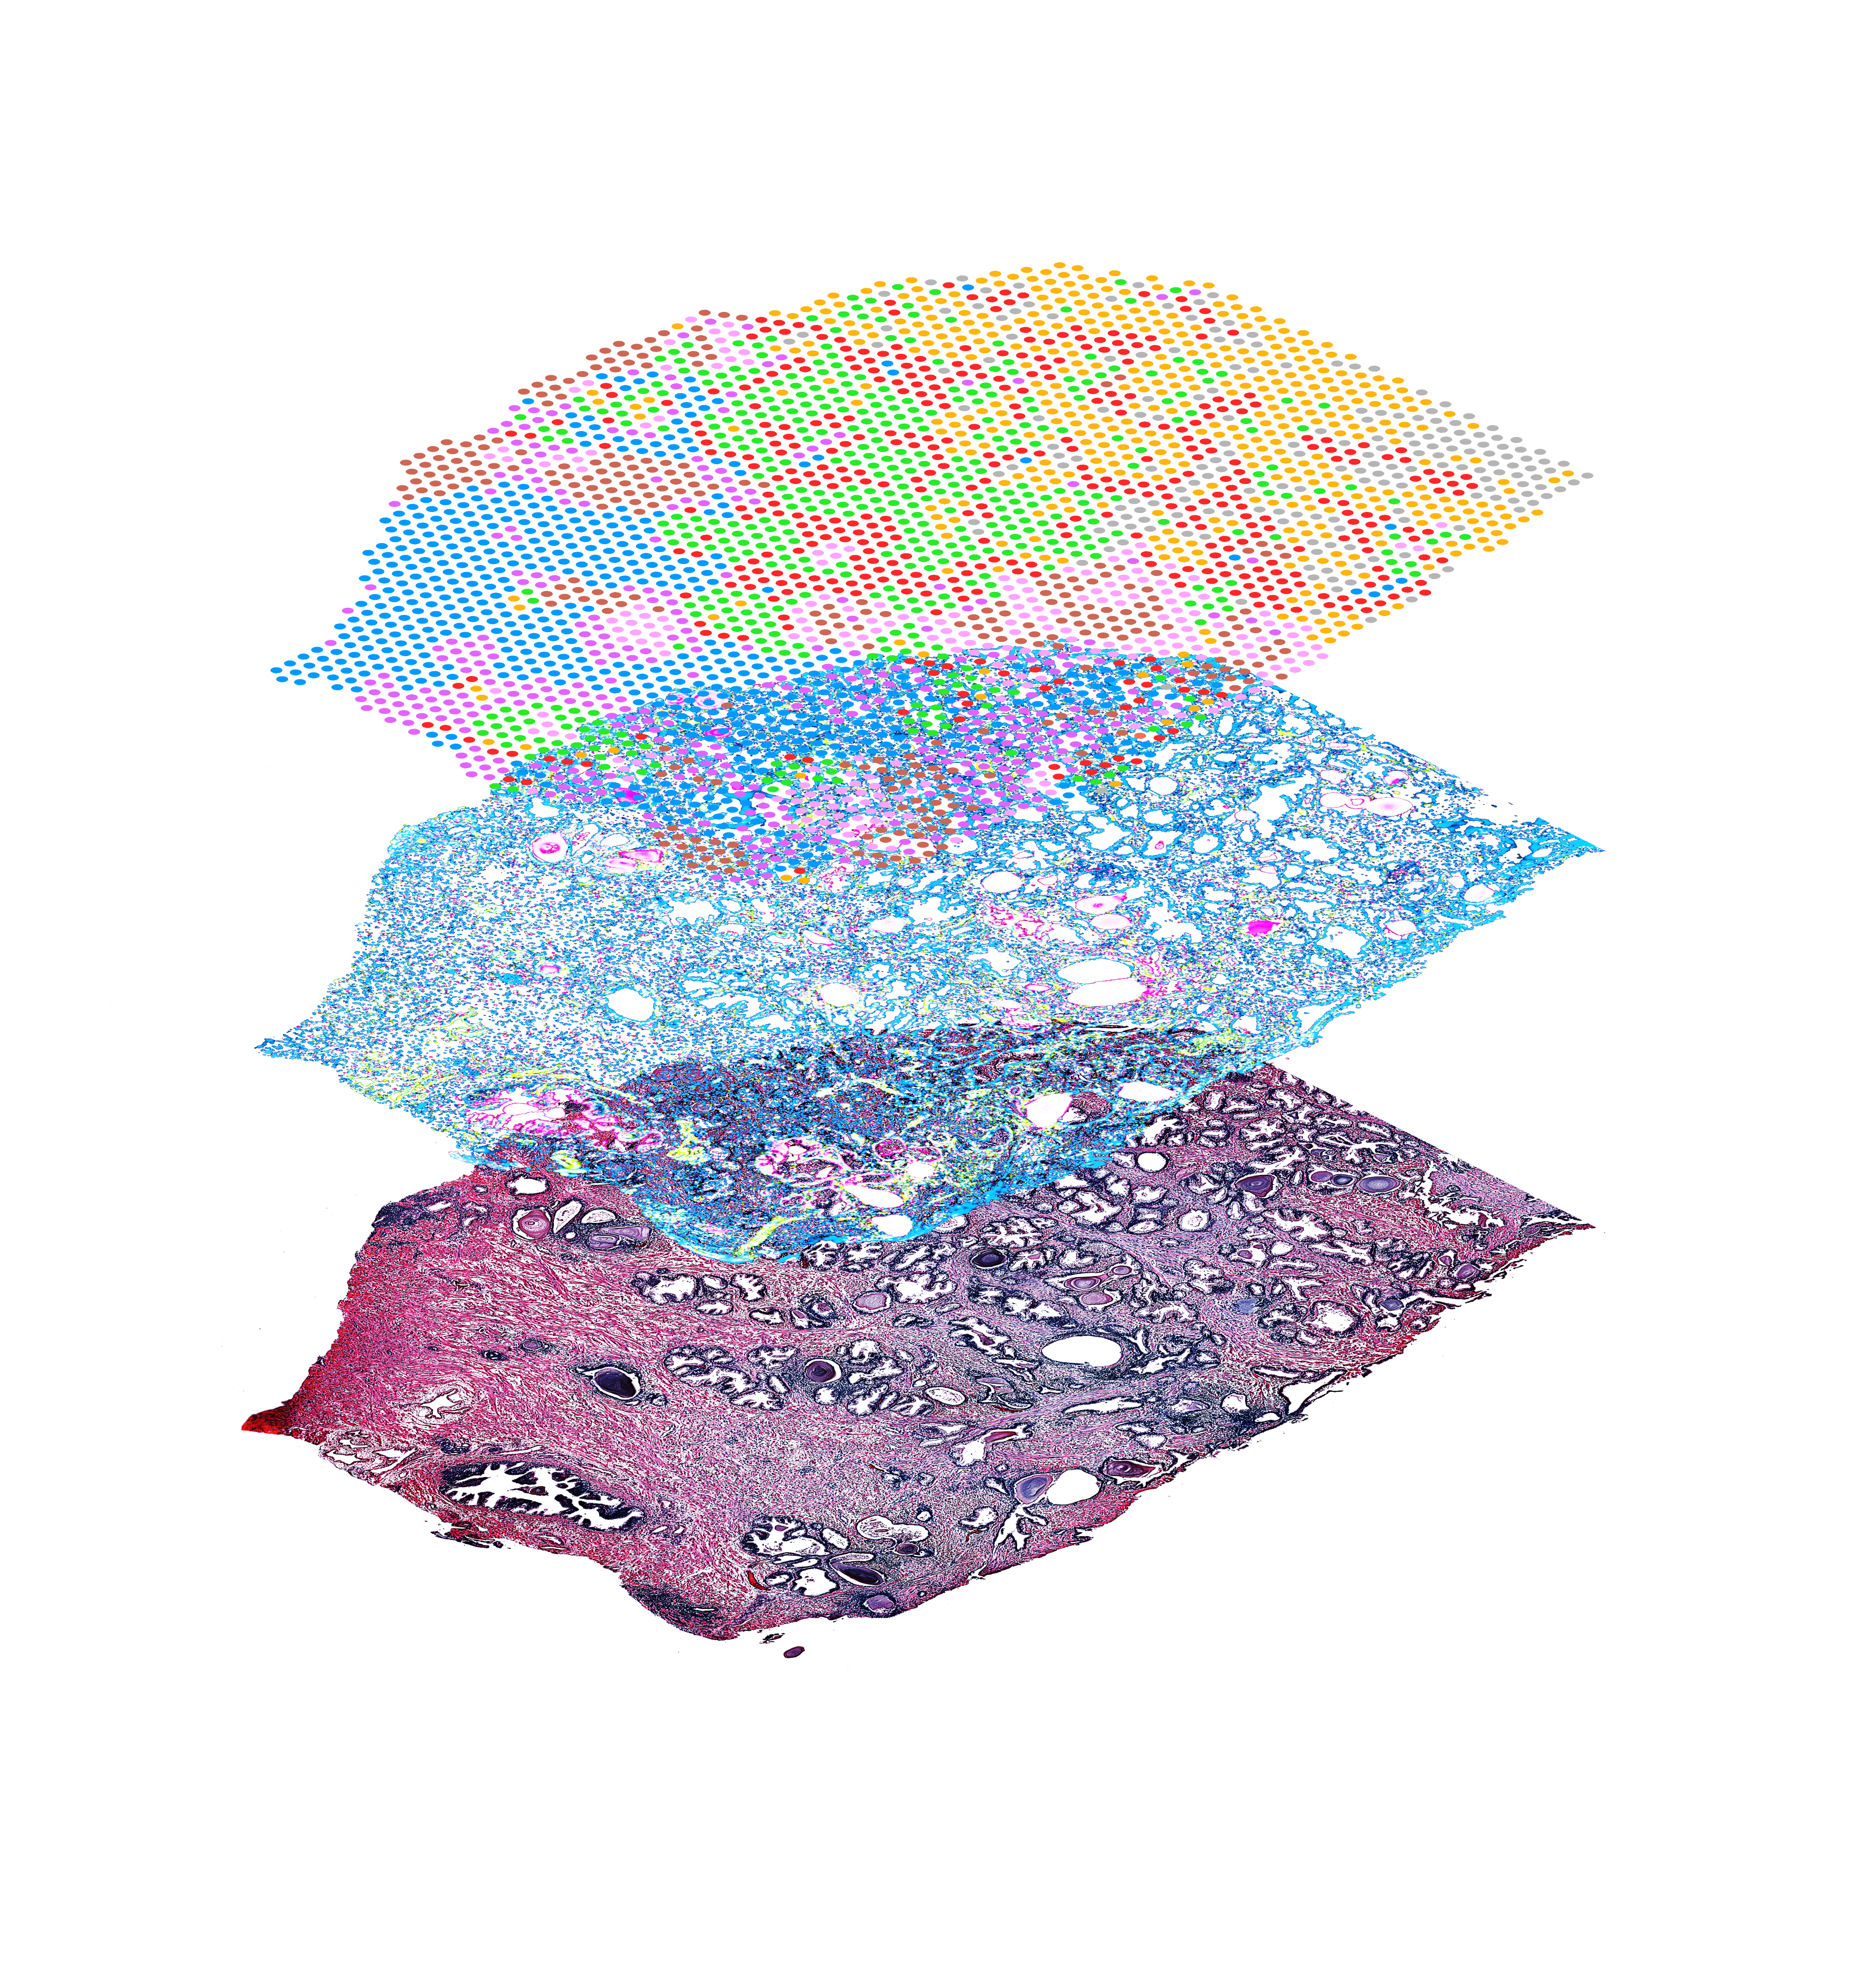
Use the sliders to adjust how you visualize and combine the tissue image and the gene expression data. Colors represent clusters identified by differentially expressed genes.
丰富的见解
- 单张切片上的多组学分析 - 利用专业甄选且预先验证的抗体组合来研究单张组织切片上的蛋白质和RNA
- 囊括组织学信息 - 目前唯一让您在其他化学分析方法处理之前对H&E或IF染色进行成像的多重蛋白分析
- 无偏的探索与发现 - 通过全转录组检测实现无偏的基因表达分析,无需利用预先确定的生物标志物来选择感兴趣的区域(ROI)
久经考验的结果
Publications
Transcriptome-scale spatial gene expression in the human dorsolateral prefrontal cortex
Transcriptome-scale spatial gene expression in the human dorsolateral prefrontal cortex
Maynard KR, et al. Nature (2021).
Maynard KR, et al. Nature (2021).
Mapping the developing human immune system across organs
Mapping the developing human immune system across organs
Suo C, et al. Science (2022).
Suo C, et al. Science (2022).
Single-cell and spatial analysis reveal interaction of FAP+ fibroblasts and SPP1+ macrophages in colorectal cancer
Single-cell and spatial analysis reveal interaction of FAP+ fibroblasts and SPP1+ macrophages in colorectal cancer
Qi J, et al. Nature Communications (2022).
Qi J, et al. Nature Communications (2022).
Resources
Find the latest app notes and other documentation Spatial Gene Expression.
完整的工具箱
Workflow
- 1
Prepare your sample
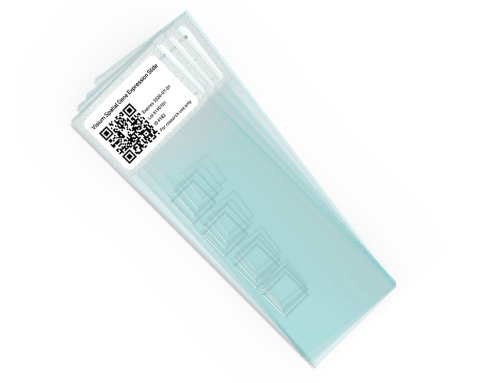
Embed, section, and place fresh frozen or FFPE tissue onto a Capture Area of the gene expression slide. Each Capture Area has thousands of barcoded spots containing millions of capture oligonucleotides with spatial barcodes unique to that spot.
Resources - 2
Stain and image the tissue
Utilize standard fixation and immunofluorescence (IF) staining to visualize tissue sections and protein markers using a fluorescent microscope.
Resources - 3
Permeabilize tissue and construct library
For fresh frozen tissue, the tissue is permeabilized to release mRNA from the cells, which binds to the spatially barcoded oligonucleotides present on the spots. A reverse transcription reaction produces cDNA from the captured mRNA. The barcoded cDNA is then pooled for downstream processing to generate a sequencing-ready library. For FFPE tissues, tissue is permeabilized to release ligated probe pairs from the cells, which bind to the spatially barcoded oligonucleotides present on the spots. Spatial barcodes are added via an extension reaction. The barcoded molecules are then pooled for downstream processing to generate a sequencing-ready library.
Resources - 4
Sequence
The resulting 10x Barcoded library is compatible with standard NGS short-read sequencing on Illumina sequencers, for massive transcriptional profiling of entire tissue sections.
Resources - 5
Analyze and visualize your data
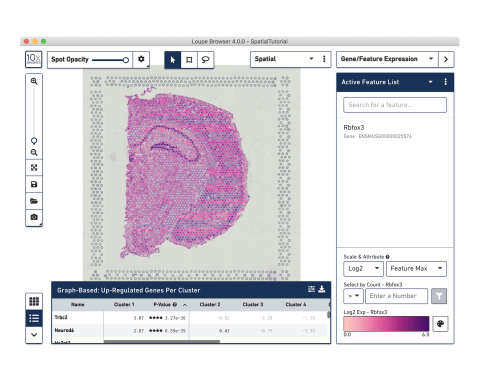
Use our Space Ranger analysis software to process your Spatial Gene Expression data, and interactively explore the results with our Loupe Browser visualization software.
Do I need to be a bioinformatician to use Loupe?
Loupe is a point-and-click software that’s easy for anyone to download and use.
Resources
常见问题
Visium CytAssist空间基因和蛋白表达分析旨在为经过Visium CytAssist处理的FFPE样本引入同步的基因表达和蛋白质表达分析。该分析利用NGS来测定寡核苷酸标记抗体的丰度,具有空间分辨率,并提供全转录组数据和形态学图像。
Visium CytAssist基因和蛋白表达解决方案能够让研究人员分析人类免疫细胞分析组合中各种蛋白质的相对表达模式。基于NGS的基因表达读数能够克服光谱重叠和抗体宿主物种受限等挑战,这些挑战通常会导致组织中可同时研究的蛋白数量受到限制。此外,它还能检测通常以低表达RNA形式出现的免疫蛋白标志物。
我们的组合特有35种抗体,来自Abcam和Biolegend,针对细胞表面靶点和细胞内靶点。关于所包含抗体的具体列表,请查看支持页面上的抗体列表或FAQ中的附录。
10x Genomics提供了两种类型的软件,可帮助您分析数据:Space Ranger和Loupe Browser。Space Ranger分析软件能够自动将空间基因表达信息与组织图像相叠加,鉴定出转录图谱相似的数据点集合。随后,您可以利用Loupe Browser可视化软件来交互式地探索实验结果。您可以在10x Genomics支持页面上免费下载Spacer Ranger和Loupe Browser。
由于Visium分析灵敏度高,对Visium性能的影响可能因组织而异。不过,对于H&E和IF来说,两者的基因表达空间结构和细胞簇检测是相当的。
