CD8+ T cells of Healthy Donor 2
Universal 5' dataset analyzed using Cell Ranger 3.0.2


Learn about Chromium analysis
10x Genomics purchased CD8+ T cells of a healthy donor* from STEMCELL Technologies. The cells were labeled with a panel of 50 dCODE™ Dextramer® reagents (Immudex) and 14 TotalSeq™-C antibodies (BioLegend) and then sorted. Sequencing-ready libraries were generated from both sorted and unsorted cells and analyzed (illustrated below). For more information, see the Application Note “A New Way of Exploring Immunity - Linking Highly Multiplexed Antigen Recognition to Immune Repertoire and Phenotype”.
Amplified cDNA from sorted or unsorted labeled cells was used to generate gene expression and cell surface protein libraries following the Single Cell V(D)J Reagent Kits User Guide (CG000186 RevA). The same cDNA was used to generate TCR enriched libraries. (Due to the low cell numbers obtained after sorting, all the sorted cells were used for library generation).
5' Gene Expression + Cell Surface Protein Libraries
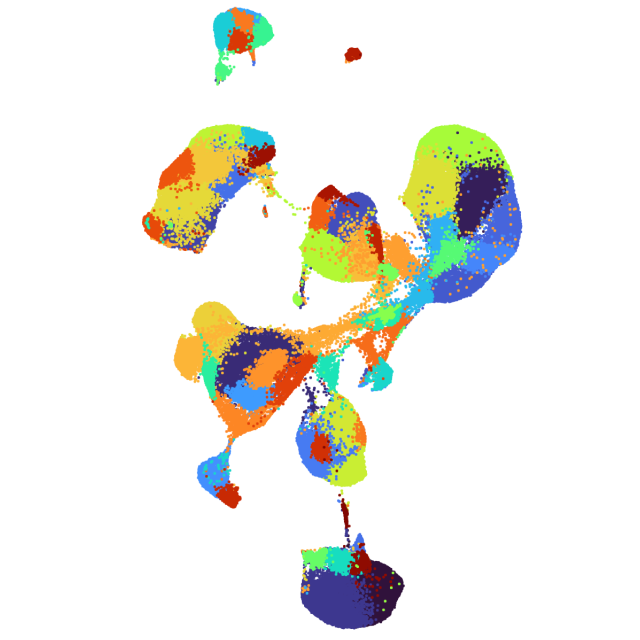
The gene expression and cell surface protein libraries from the sorted and unsorted cells were sequenced on an Illumina NovaSeq 6000 (NovaSeq software v1.5) with ~50,000 read pairs per cell, including 26 bp read 1 (16 bp 10x barcode and 10 bp UMI), 91 bp read 2 (transcript), and 8 bp i7 sample index read configuration. The data were aggregated using cellranger aggr with normalization_mode adjusted to none.
The key cell metrics were:
- Cells detected -- 91,921
- Median genes per cell -- 1,456
- Median UMI counts per cell -- 4,295
TCR Enriched Libraries
The TCR enriched libraries from the sorted and unsorted cells were sequenced on an Illumina NovaSeq 6000 (NovaSeq software v1.5) with ~18,000 read pairs per cell, including 150 bp read 1 (16 bp 10x barcode, 10 bp UMI, 13 bp Template Switch Oligo and transcript), 91 bp read 2 (transcript), and 8 bp i7 sample index read configuration. The data were aggregated using a custom CellRanger MRO.
The key cell metrics were:
- Cells detected -- 80,207
- Cells with productive V-J spanning (TRA, TRB) pair -- 78.4%
Binarized Matrix Calls
The binarized matrix CSV file contains a row for each cell in the dataset. Columns contain TCR CDR3 sequences and UMI counts for the TotalSeq-C antibodies and dCODE Dextramer reagents. Additional columns indicate whether the cell has specificity to each pMHC multimer according to the filters described in the Application Note A New Way of Exploring Immunity – Linking Highly Multiplexed Antigen Recognition to Immune Repertoire and Phenotype.
Specifically, a threshold was set requiring a specific binding event for a UMI count greater than 10 and greater than five times the highest negative control UMI count for that cell. In cases where a cell was assigned more than one specificity, it was considered specific only for the pMHC with the highest UMI count. Cells with apparent specificities of more than four dCODE Dextramer reagents were excluded.
*Cells from Donors 1 and 2 were mixed prior to labeling with Totalseq-C antibodies and dCODE Dextramer reagents and then sorted to generate libraries. The mixed population was labeled in two separate experiments, each containing 20 million cells; the first labeling experiment did not include TotalSeq-C antibodies to CCR7 and HLA-DR. After sequencing, cell barcodes were assigned to each donor using SNPs present in the gene expression sequencing reads with SNPclust. The sequencing FASTQ files were thus demultiplexed for each library from those two donors and used as input into the Cell Ranger pipeline. The data presented here are from the cells assigned to Donor 2.
This dataset is licensed under the Creative Commons Attribution 4.0 International (CC BY 4.0) license. 10x citation guidelines available here.