Cell Ranger (v9 and later) and Cell Ranger ARC (v2.1 and later) include automated cell type annotation, which can be applied to the Gene Expression outputs of Cell Ranger count, multi, and aggr to generate accurate cell type labels. This method assigns cell types by comparing gene expression profiles to annotated reference datasets, avoiding reliance on marker genes or tissue-specific references. The cell annotation models are in beta.
Each cell barcode's gene expression profile is compared to a model built on the Chan Zuckerberg CELL by GENE (CZ CELLxGENE) census to identify the most similar cell types. A consensus label is then assigned to each barcode, with the results summarized in the web_summary.html. These labels can be viewed in Loupe Browser or accessed via the cell_types.csv output file which also contains the primary fine grain cell annotation.
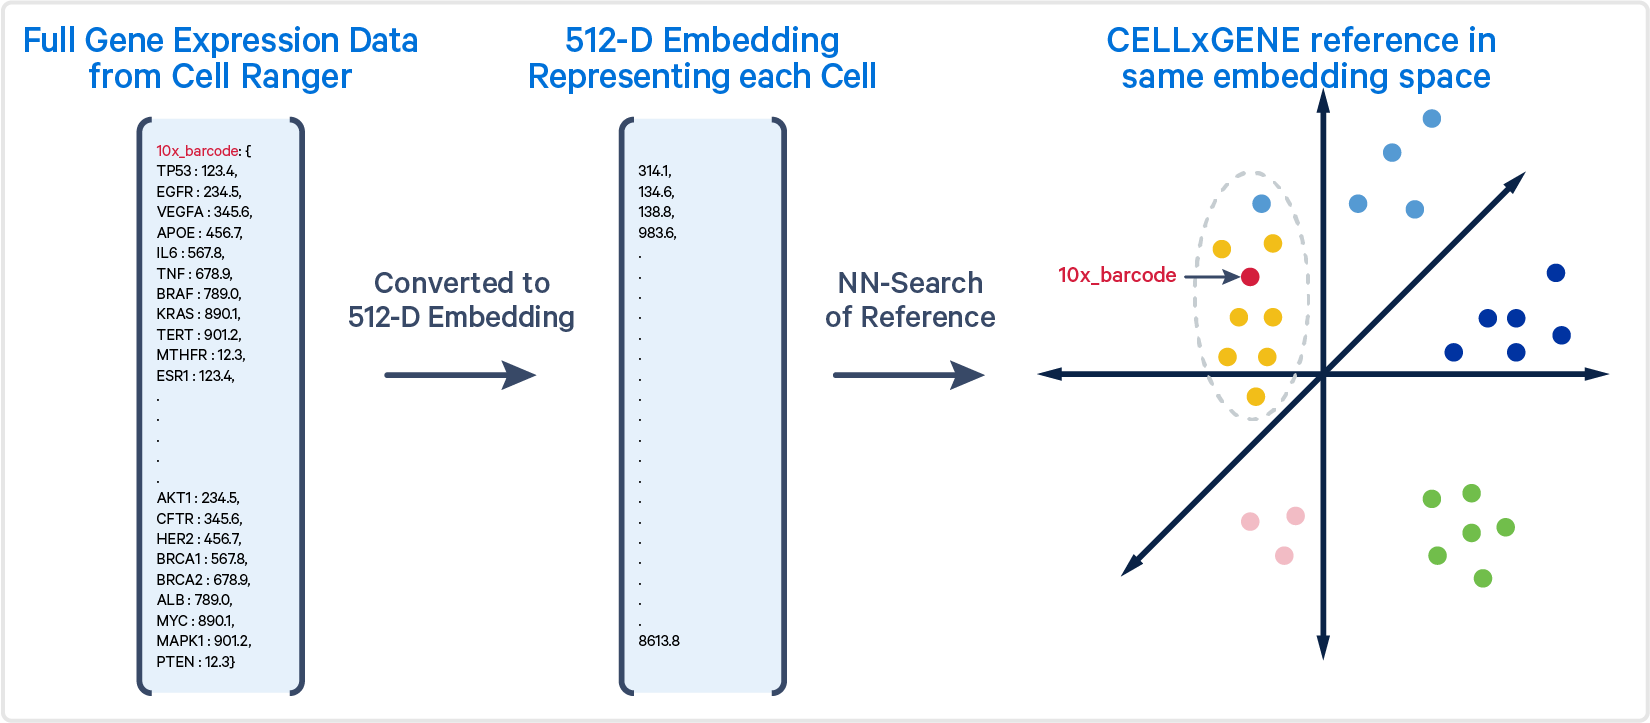
The algorithm generates an embedding for each cell barcode. The gene expression profile of each cell barcode being analyzed is projected into the same embedding. To classify a cell, the algorithm performs an approximate nearest-neighbor (ANN) search, identifying the 500 most similar cells in the reference set based on these embeddings. The most common cell type among these nearest neighbors is then assigned to the query cell. Models may differ in their inputs (e.g., all genes vs specific genes) and how they calculate embeddings. The models are described in more detail below.

This figure shows the gene expression profile of a single 10x Barcode (shown in red), transformed into an embedding. The approximate nearest neighbors (primarily yellow cells) of the 10x Barcode are shown within the grey circle.
Cell type terms are sourced from the Cell Ontology, which CZ CELLxGENE uses to annotate all datasets. The reference datasets can vary in the granularity of annotations— some experts may assign highly specific terms like "CD8-positive, CD25-positive, alpha-beta regulatory T cell," while others might use broader classifications such as "T cell." The cell annotation algorithm may show poor performance with samples such as cancers or cell lines, as these are not well represented in the CZ CELLxGENE database.
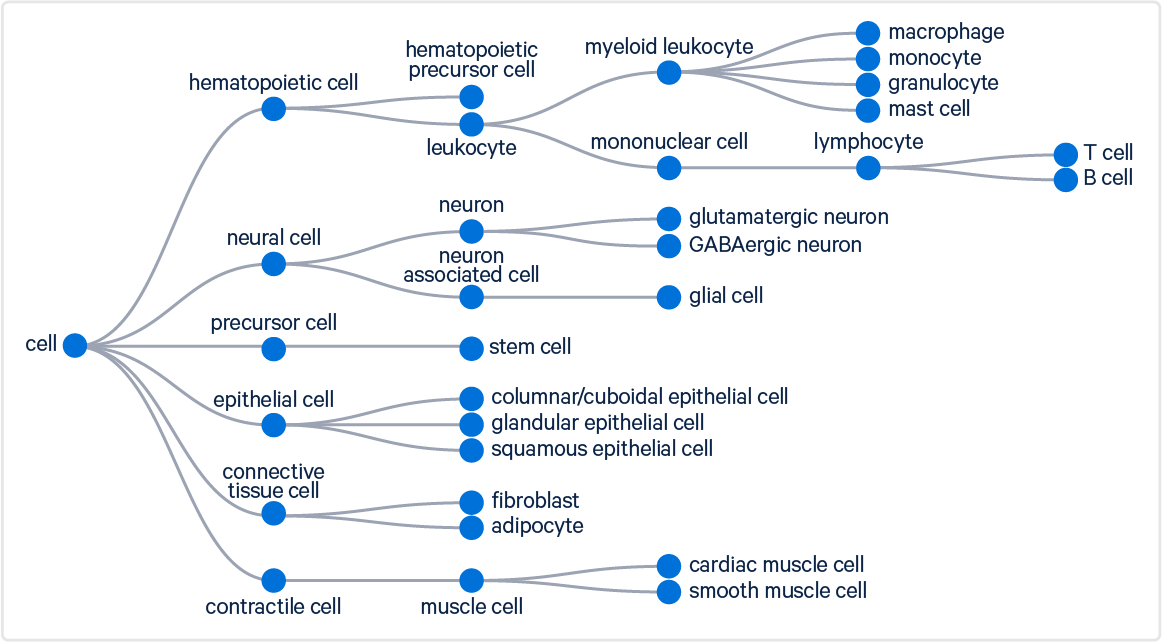
Our goal is to help users identify high-level cell types (e.g., T cells, B cells). To achieve this, the algorithm maps specific terms from the Cell Ontology to selected high-level cell types. These broader categories are displayed in both the web_summary.html and the .cloupe file. Some selected groups are illustrated in the figure below:

Coarse and fine cell type annotations are available in the cell_types.csv file, which offers the option to refine classifications further.
We aim to support users seeking high-level cell type groupings. Coarse and fine cell type annotations are available in the cell_types.csv file, which offers the option to refine classifications further.
Release dates for the latest models can be found on the Annotation Models Release Notes page.
The human human_pca_v1_beta model is generated by first applying principal component analysis (PCA) to the reference dataset, extracting the top 512 components for each reference cell.
The inputs to the model are normalized to control for differences in library size, where normalization is:
where tc = 10000; tc is the target count, a constant equal to 10,000,
tmu represents the total mRNA UMIs, which is the sum of all counts per cell.
represents the expression value of gene g in cell n. This value is a measure of gene expression, such as counts or normalized expression levels, and is used as the input for various normalization and modeling procedures.
These values are then Log1p normalized and Z-score normalized. These are defined as:
-
Log1p normalization: This is defined as
-
Z-score normalization: Transform the expression data so that it has a mean of 0 and a standard deviation of 1.
It is defined as:
Z-score normalization requires a summary statistics artifact, which includes mean (µ) and standard deviation (σ). When Z-score normalization is used in conjunction with Log1p, the summary statistics artifact is calculated based on the Log1p-transformed data.
We benchmarked five human tissues—brain, blood, heart, kidney, and lung—some of which included multiple tissue types. The datasets consisted of both cell and nuclei data, tested using 3’ Single Cell Gene Expression v2 and v3 chemistries, as well as 5’ Single Cell Immune Profiling v1 and v2 chemistries.
The mouse mouse_pca_v1_beta model is generated by first identifying the top 10,000 highly variable genes in the reference database. The inputs to the model are normalized to control for differences in library size, where normalization is:
where tc = 10000; tc is the target count, a constant equal to 10,000,
tmu represents the total mRNA UMIs, which is the sum of all counts per cell.
represents the expression value of gene g in cell n. This value is a measure of gene expression, such as counts or normalized expression levels, and is used as the input for various normalization and modeling procedures.
These values are then Log1p normalized and Z-score normalized. These are defined as:
-
Log1p normalization: This is defined as
-
Z-score normalization: Transform the expression data so that it has a mean of 0 and a standard deviation of 1.
It is defined as:
Z-score normalization requires a summary statistics artifact, which includes mean (µ) and standard deviation (σ). When Z-score normalization is used in conjunction with Log1p, the summary statistics artifact is calculated based on the Log1p-transformed data.
Principal component analysis (PCA) is performed on the normalized expression values of the highly variable genes and the top 128 components for each reference cell are used for the embedding.