Optimizing your spatial transcriptomics research with Visium HD and Xenium Prime 5K

Editor’s note: This post was updated on August 19, 2024 with new information on performance comparisons between Visium HD and Xenium Prime 5K based on data from our recent preprint.
Novel spatial transcriptomics tools blend traditional imaging with molecular analysis to give you a more complete picture of your biology of interest. Whether you are a neuroscientist untangling the complexity of the nervous system, a translational researcher better resolving the tumor microenvironment in cancer, or trying to answer any of a myriad of other questions, spatial insights open new doors for your research projects. Given the promise of these methods and their increasing adoption, the question has morphed from, “Why should I do spatial biology?” into, “What do I want to achieve with spatial biology—and how should I do it?”
To equip you to ask the questions you want to ask, we’ve developed two complementary spatial transcriptomics methods for high-resolution spatial analysis at ultra-high plex: our NGS-based whole transcriptome Visium Spatial Gene Expression (which includes “standard definition” Visium, Visium v2, and our latest Visium HD) and Xenium Prime 5K, our targeted imaging-based, 5000-plex in situ gene expression assay that runs on the Xenium Analyzer. Which one is the best fit for your current applications—or if they should be used together—depends on your research project, your goals, and your practical considerations.
We created this guide to familiarize you with our Visium HD and Xenium Prime 5K technologies and break down important criteria when incorporating spatial transcriptomics into your research.
Technical specs
Plexity
How many genes, isoforms, and/or variants you can detect in a single run.
Find resources for the Visium HD custom probe spike-in here.
Sensitivity
Defines how well you can detect transcripts, and can be broken down into per-gene sensitivity, gene detection, and transcript abundance.
*Based on data generated in our recent Technical Note, Xenium Prime 5K Gene Expression Workflow, Analysis & Data Highlights (CG000775).
Resolution
Covers where your transcripts are assigned—to a defined tissue area or by cell—and the finest level of detail in which you can see them.
Multiomics
The complete set of analytes you can measure in addition to RNA, such as morphology, protein, etc.
Tissue fixation, organism, and tissue format
A complementary spatial toolkit: Visium HD and Xenium Prime 5K
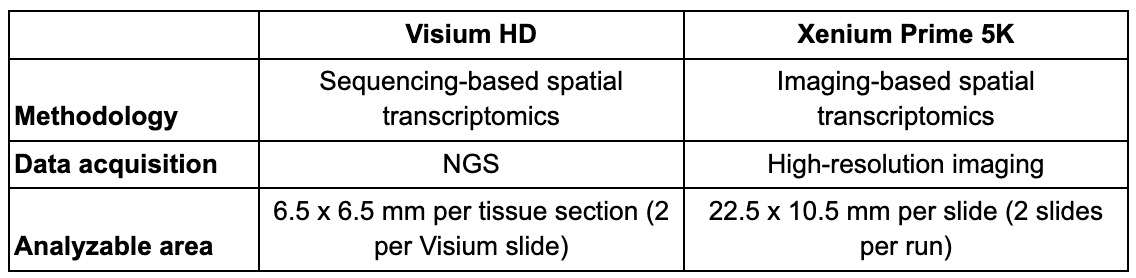
When looking to discover new targets, or broadly characterize your tissue of interest, the whole transcriptome analysis afforded by Visium HD Spatial Gene Expression is a powerful tool. Visium HD is a sequencing-based spatial transcriptomics assay that uses probe-based chemistry to provide whole transcriptome analysis with spatial context. Probes are hybridized to their targets and ligated in your tissue on a standard slide. Unbound probes are washed off and then bound probes are precisely transferred onto a Visium HD slide via the CytAssist (a critical step for providing increased spatial fidelity by minimizing diffusion). These probes are then used to generate spatially barcoded NGS libraries for a sequencing-based readout. (A more in-depth explanation of how Visium HD works can be found here.)
If you need precision insights for your genes of interest, Xenium In Situ with our Xenium Prime 5K assay offers nanometer-scale resolution of up to 5,000 genes within individual cells across whole tissue sections. Xenium is an imaging-based spatial transcriptomics assay that uses padlock probes targeting pre-selected genes. After hybridization to their target transcript, the probes are then circularized by ligation (adding an additional layer of confidence in target specificity) and amplified in a rolling circle amplification reaction. The amplified products are detected on the Xenium Analyzer by multiple rounds of fluorescent probe hybridization, tissue imaging, and probe removal, resulting in an imaging-based readout. (A more in-depth explanation of how Xenium works can be found here.)
Finally, it’s important to note that Visium and Xenium are not meant to be “either-or” but to complement each other and provide the clearest picture of your biology. This was exemplified in our recent Technical Note, where we highlighted the performance of each platform and noted their unique strengths. By combining these tools you can get the best of both worlds; for example, Visium can help you to build a spatial atlas of your tissue in health or disease, then you can proceed to drill down into finer analyses with Xenium. This is exactly what Dr. Ayako Suzuki and colleagues did in their latest Nature Communications publication—first using Visium v2 to determine where gene expression changes were occurring in lung cancer tumors, then zooming in with a Xenium Human Lung Gene Expression panel to pinpoint specific cells and cell types associated with alveolar collapse in a subtype of tumors. We’ve also written a blog that dives further into this example and explores multiple studies in which other researchers have similarly combined the unique strengths of each platform in their work.
Pondering plexity: Whole transcriptome, targeted analyses, and customization options
*Plexity: How many species of RNA (genes, exogenous genes, isoforms, etc.) you can measure in a single analysis.*
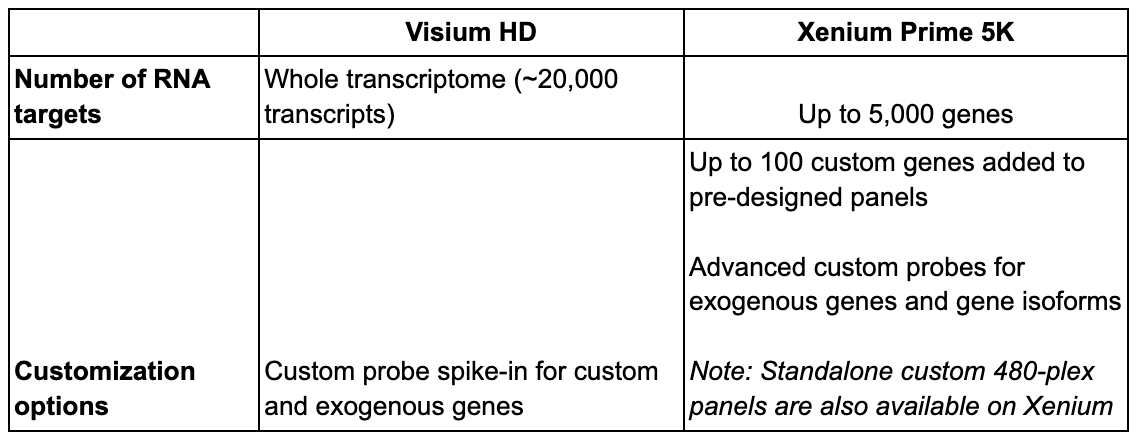
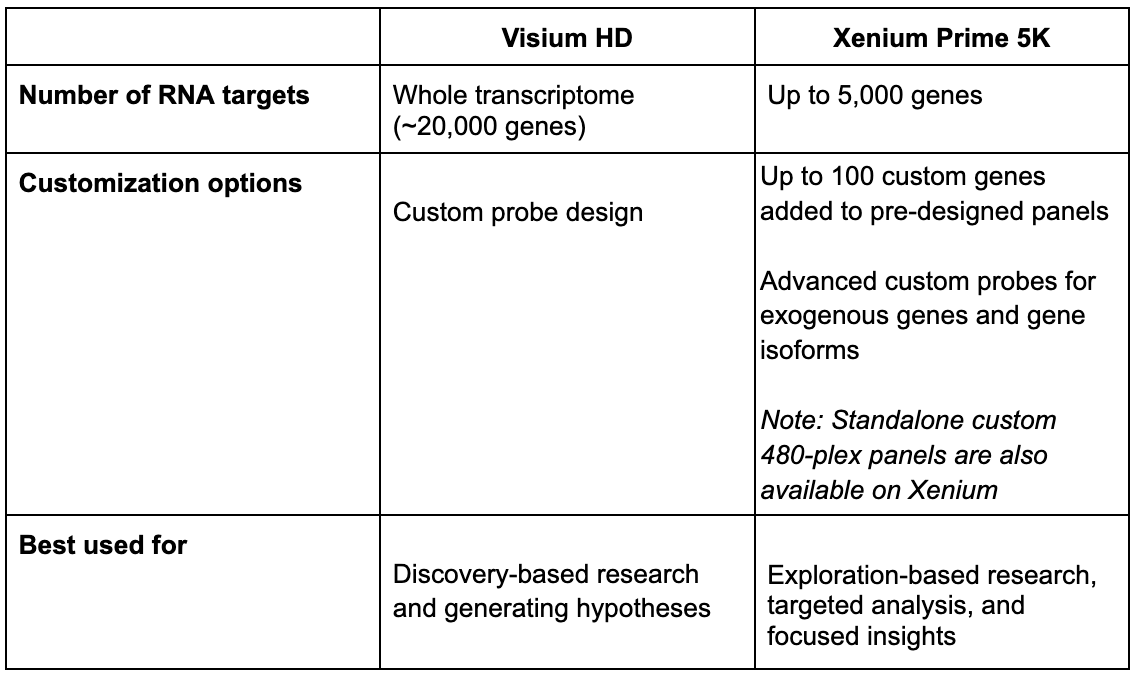
Each platform offers a different breadth and depth of transcript coverage. To deliver wide breadth, Visium HD enables unbiased coverage of the whole transcriptome (~20,000 genes). Coupled with the ability to design custom probes for additional targets of interest, Visium HD offers unparalleled spatial discovery power for broad tissue characterization, de novo identification of regions/cell types of interest, and more.
Meanwhile, Xenium Prime 5K features targeted analysis of 5,000 genes of interest. This ultra high-plex panel can be further customized with the addition of up to 100 target genes. Alternatively, you can design a standalone custom 480-plex panel for your own targeted Xenium assay, and the Advanced Custom Design option also lets you detect exogenous genes and isoforms of your genes of interest. Xenium is unrivaled if you already know what you want to look at (or at least have a very general idea with exploration-based research) and want to take a very deep look into it.
Takeaway:
Characterizing sensitivity: Per-gene sensitivity, gene detection, and transcript abundance
*Sensitivity: Defines how well you can detect transcripts. While often used broadly in regards to spatial technologies, it can be broken down into: per-gene sensitivity, gene detection, and transcript abundance. Which term is used depends on the specific aspect(s) of performance the author is trying to highlight.*
- *Per-gene sensitivity: The number of transcripts per gene your assay is able to detect. This is critical in applications like performing differential gene expression and detecting rare transcripts, gene isoforms, and variants. Coupled with gene detection (see below) this metric helps define your assay’s dynamic range.*
- *Gene detection: How many different transcript species you’re able to detect per cell or tissue area as a function of per-gene sensitivity, plexity, and tissue type. Gene detection is invaluable in discovery-based applications, such as characterizing tissues of interest in health and/or disease states.*
- *Transcript abundance: The total number of transcripts detected per cell or tissue area. Can be used to identify broad-scale changes in overall gene expression. Calculated as a function of your assay’s per-gene sensitivity, gene detection, assay plexity, and total tissue area analyzed.*
So how do the sensitivities of Xenium Prime 5K and Visium HD compare? In a recent Technical Note, we used the Visium HD and the Xenium Human Colon Gene Expression Panel to examine how they performed. FFPE sections were taken from 8 different Visium HD datasets across 4 tissue blocks (human brain cancer, human ovarian cancer, mouse healthy intestine, and human lung cancer), each with a matching Xenium region.
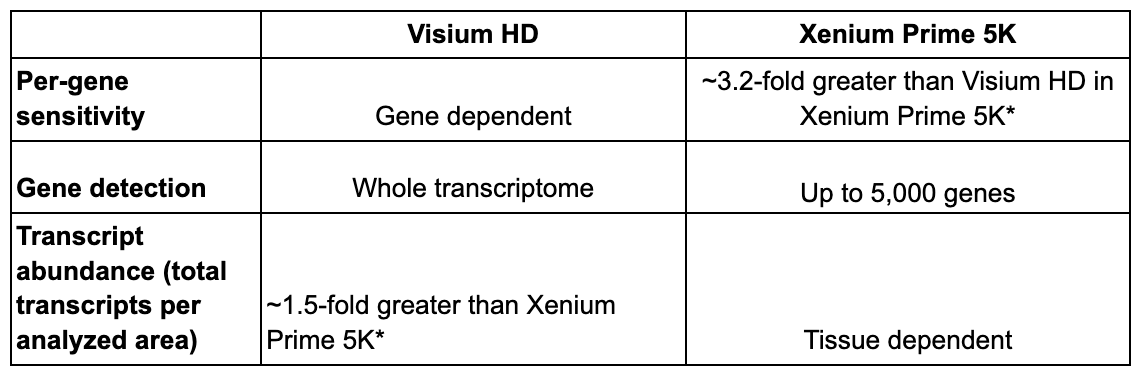
When evaluating per-gene sensitivity, Xenium detected ~3.18-fold more transcripts per gene than Visium HD (Figure 1A and 1B). We note, however, that this calculation will be influenced by the sequencing depth used on Visium HD (in this instance, we sequenced Visium HD to an average saturation of 65.43%). When we examined transcript abundance, Visium HD was able to detect, on average, ~1.54-fold more transcripts overall than Xenium Prime 5K (Figure 1B).
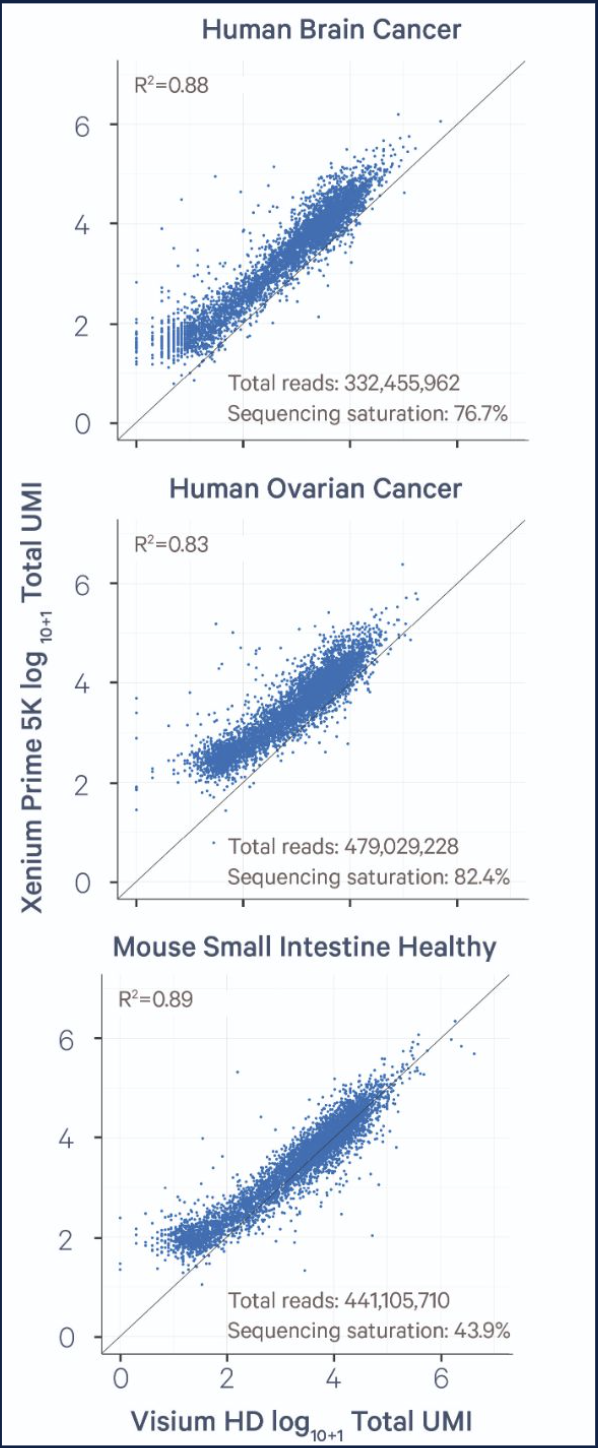
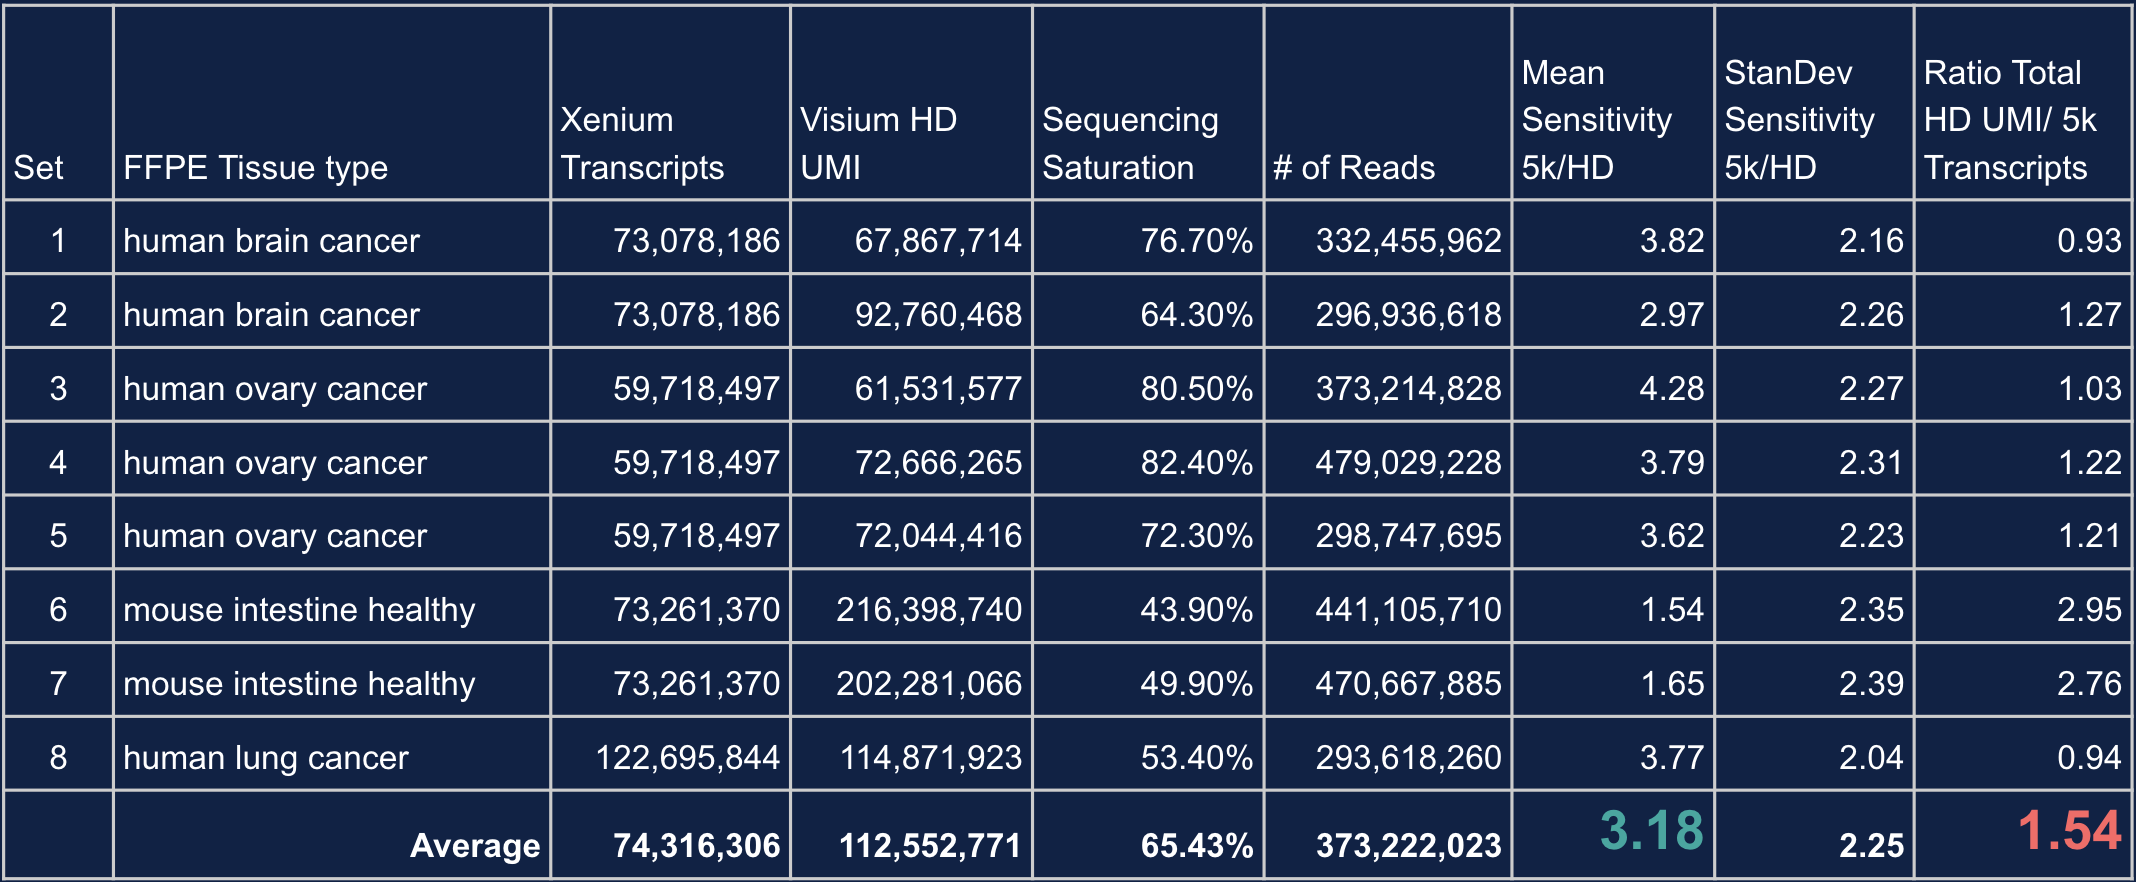
In this set of experiments, Xenium Prime 5K offered greater per-gene sensitivity than Visium HD. Visium HD exhibited higher gene detection and greater transcript abundance than Xenium. This is due, primarily, to Visium’s capture of whole transcriptome data versus Xenium Prime 5K targeting ~5,000 genes. Additionally, we emphasize sequencing saturation because, in some tissue types—but not all—sequencing above our recommended depth for Visium HD can result in higher per-gene sensitivity. This allows transcript abundance and per-gene sensitivity to be somewhat tuned with sequencing depth in some tissues and/or samples.
Takeaway:
*Based on data generated in our recent Technical Note, Xenium Prime 5K Gene Expression Workflow, Analysis & Data Highlights (CG000775).
Selecting resolution: How, and how finely, are your transcripts assigned?
*Resolution: Covers where your transcripts are assigned—to a defined tissue area or by cell—and the finest level of detail in which you can see them.*
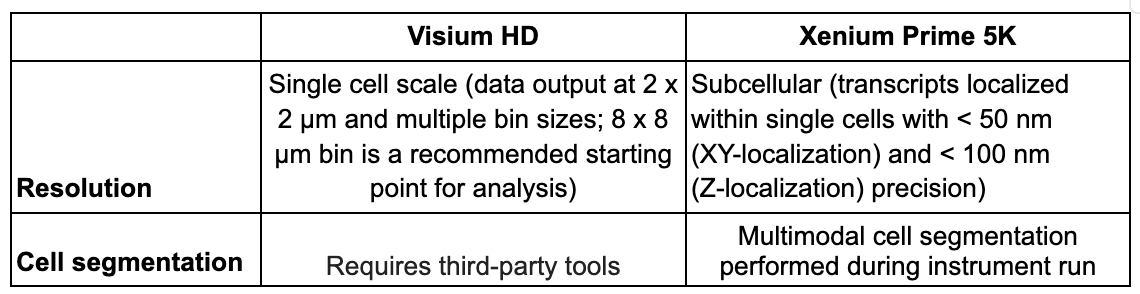
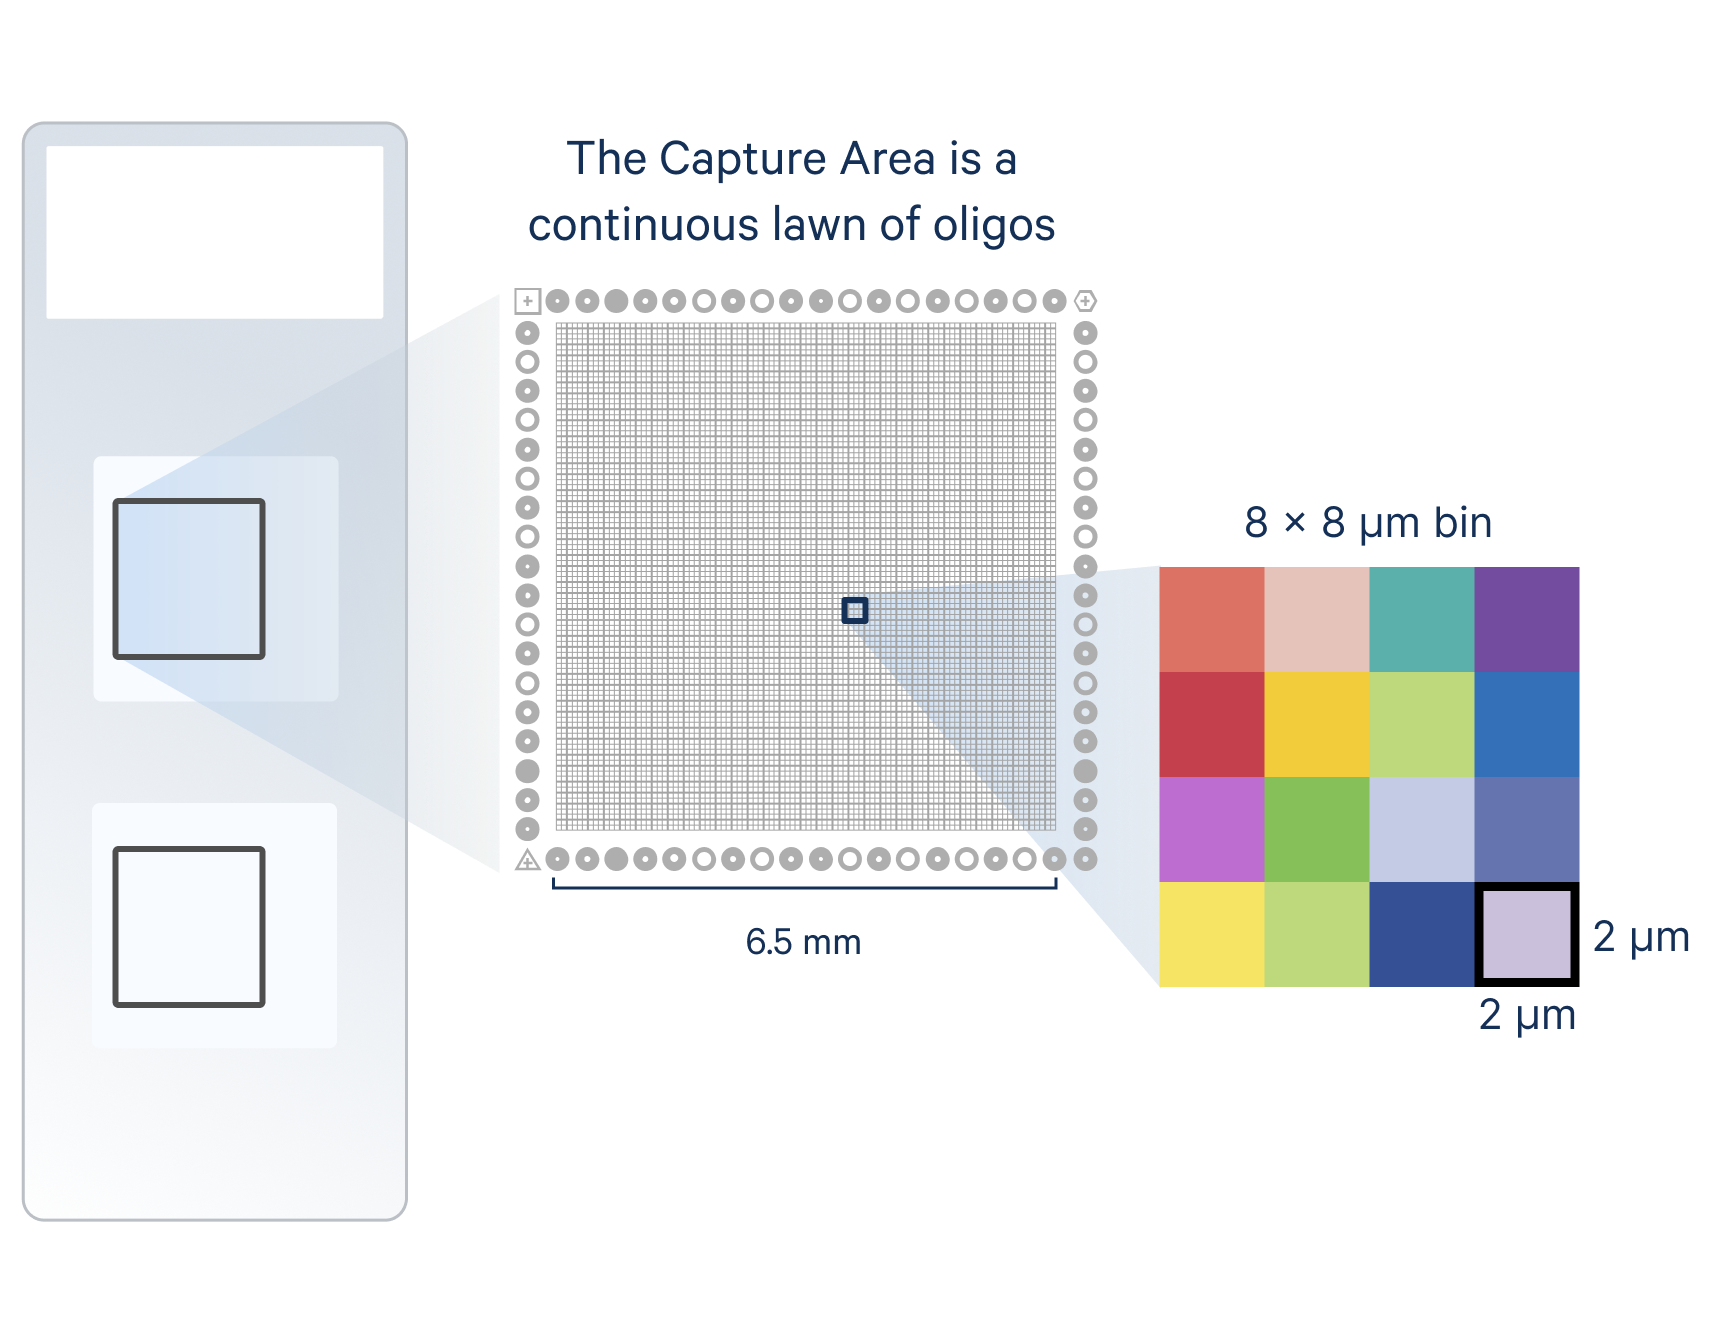
In Visium HD, transcripts are assigned to an area much smaller than most single cells. Specifically, bound probes are precisely transferred using the CytAssist instrument onto a Capture Area with a continuous lawn of oligonucleotides arrayed into millions of 2 x 2 µm barcoded squares. This spatially barcoded sequencing-based readout is then output at these 2 x 2 µm squares as well as multiple bin sizes (including 8 x 8 µm bins, which is our recommended starting point for analysis) (Figure 2A).
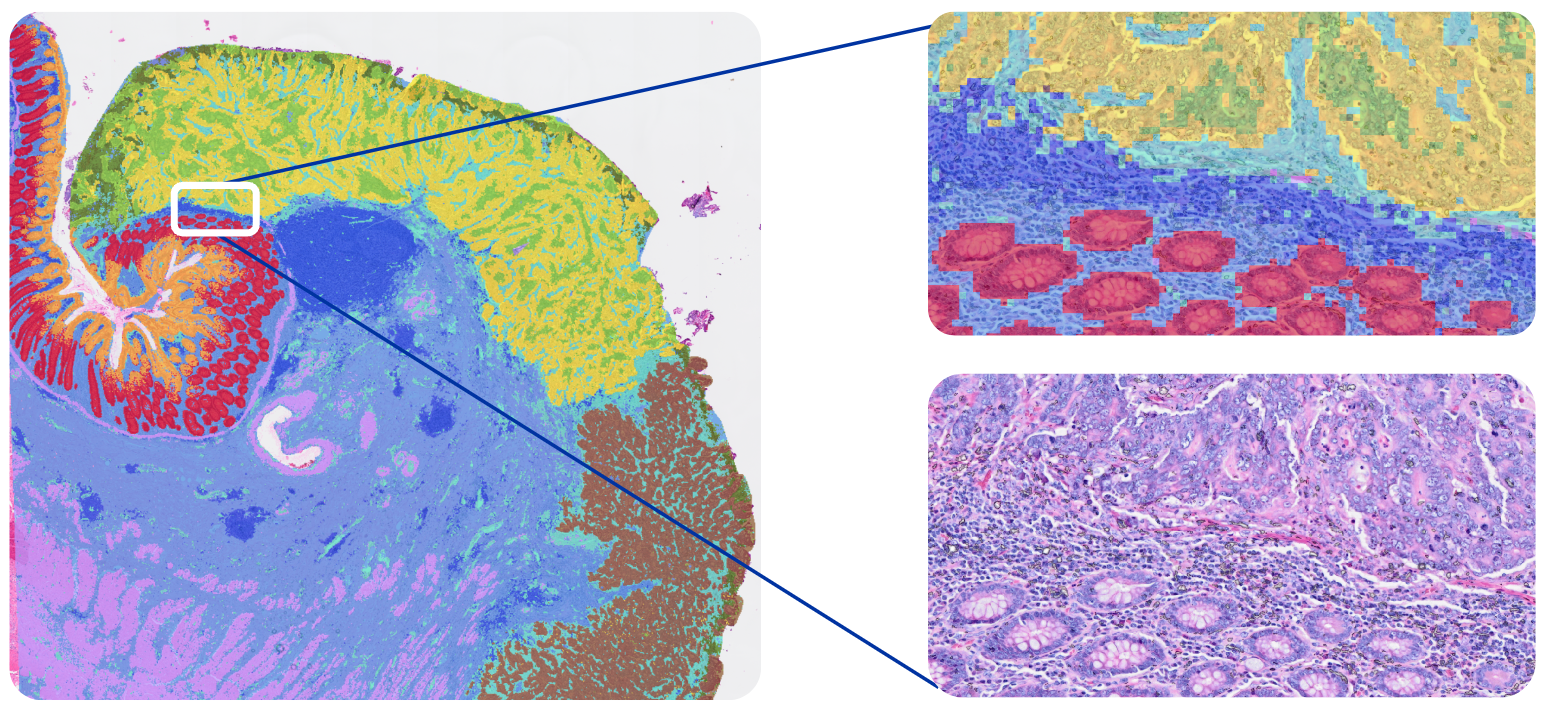
Because these squares are smaller than individual cells, this approach is able to characterize the main cell type(s) that are present in each bin. Given this binning strategy and the average size of eukaryotic cells (between 10 and 100 µm), each binned area may cover components of more than one cell; as such, Visium HD delivers what we term single cell–scale resolution (Figure 2B). Third-party tools can also enable you to perform spot deconvolution for Visium HD data.
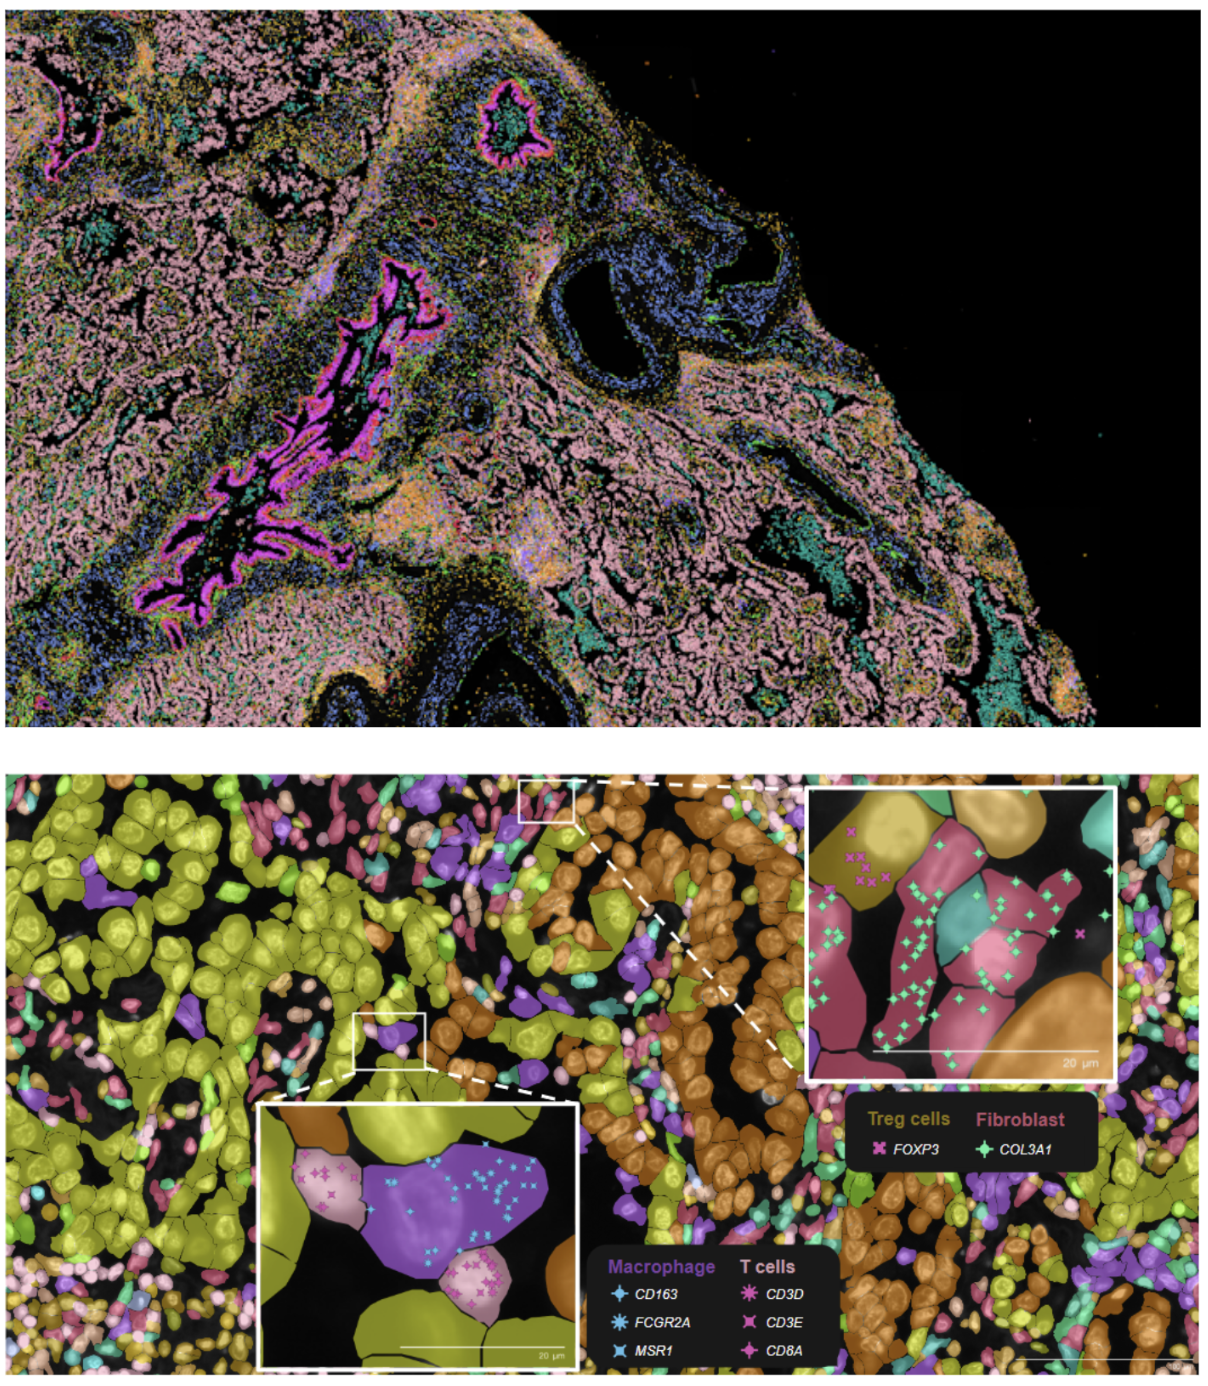
Xenium In Situ assigns transcripts to individual cells (Figure 3). During a Xenium run, each transcript is assigned X-Y-Z coordinates in the tissue. Multimodal cell segmentation is then performed on-instrument during your run, using a variety of morphological stains and a purpose-built AI algorithm to identify the boundaries of individual cells. Each transcript is then assigned to a cell based on those boundaries and its spatial coordinates, with nanometer-level precision (XY-localization < 50 nm, Z-localization < 100 nm) within the cell.
Takeaway:
Going beyond gene expression: Getting more with multiomic capabilities
*Multiomics: The complete set of analytes you can capture in addition to RNA, such as morphology, protein, etc.*
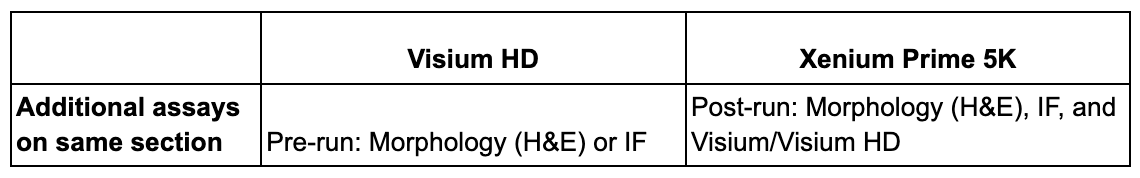
Both Visium HD and Xenium allow you to assess morphology (H&E staining), protein (immunofluorescence (IF) staining), and RNA data from the same section. At the time of writing, Visium HD allows H&E or IF on a single section, while Xenium enables both.
H&E or IF are done at the beginning of the workflow for Visium HD, which lets you use imaging data to screen tissue sections ahead of the Visium workflow. For Xenium, H&E and IF can be performed at the end of the Xenium workflow. Customers have also been taking advantage of the non-destructive nature of Xenium chemistry by running Visium on the same section post-Xenium workflow (and we’re currently quantifying what (if any) impact Xenium has on Visium HD performance).
Takeaway:
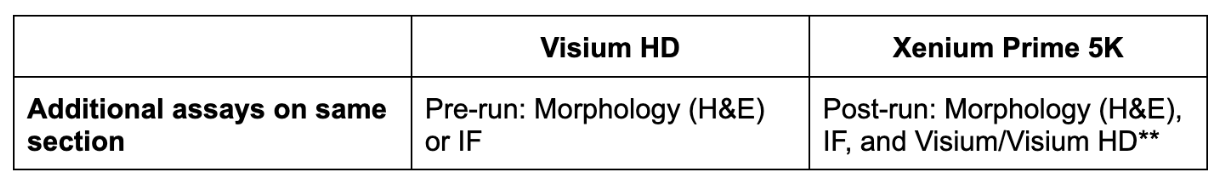
**Visium HD testing is ongoing, and we will have more data soon.
From theoretical considerations to practical concerns: Tissue type, sample format, budget considerations, and more
When looking to integrate new technologies into your lab, practicality is key. In this section, we break down some important considerations, such as tissue type, sample format, data analysis methods, and instrument access.
Tissue fixation, organism, and tissue format
Your tissue is the foundation of your experiment, and two factors—whether it’s fixed and the organism it’s derived from—will determine the course of your analysis.
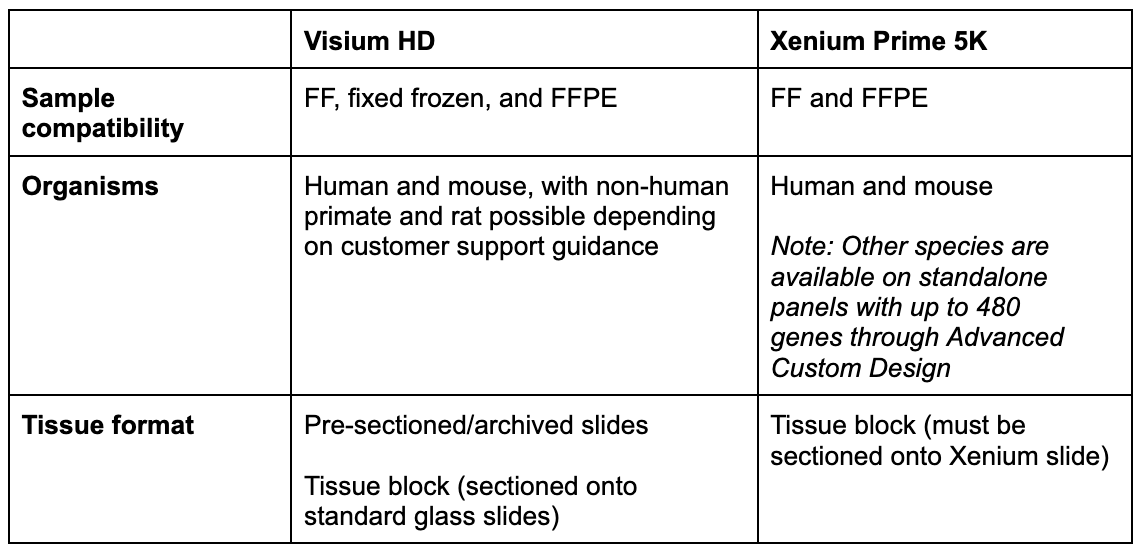
Both Xenium Prime 5K and Visium HD are compatible with formalin-fixed paraffin-embedded (FFPE) and fresh frozen (FF) tissues, while Visium HD is also compatible with fixed frozen tissues. These demonstrated protocols provide more detail for using fresh frozen and fixed frozen tissues with Visium HD.
For organism compatibility, Visium HD enables whole transcriptome analysis of human and mouse. If you are interested in analyzing non-human primate or rat tissue, please write to support@10xgenomics.com, as homology reports for the human and mouse probe sets may be available for your species. Xenium has pre-designed 5,000 gene panels for human and mouse, each of which can be customized with an additional 100 genes of interest. Furthermore, Xenium can accommodate other species through our Advanced Custom Design process, enabling you to create fully custom panels of up to 480 genes that target any organism with an annotated transcriptome.
Tissue format is also a key consideration. The Visium CytAssist instrument allows you to use archival or pre-sectioned slides, as well as slides prepared fresh from an FFPE block specifically for your experiment. Xenium requires tissue to be sectioned directly onto Xenium slides.
Takeaway: If your tissue is FFPE or fresh frozen, and either human or mouse, it’s currently compatible with either platform. Visium HD is also compatible with fixed frozen tissue, with this capability outlined in our demonstrated protocol. If you research a species that is neither human nor mouse, Xenium has compatibility with any organism through the Advanced Custom panel option, while Visium HD may be compatible with non-human primate or rat (depending on customer support guidance).
Number of samples, tissue size, and time constraints
For any technology, more samples take more time. There are, however, two major nuances to this general rule.
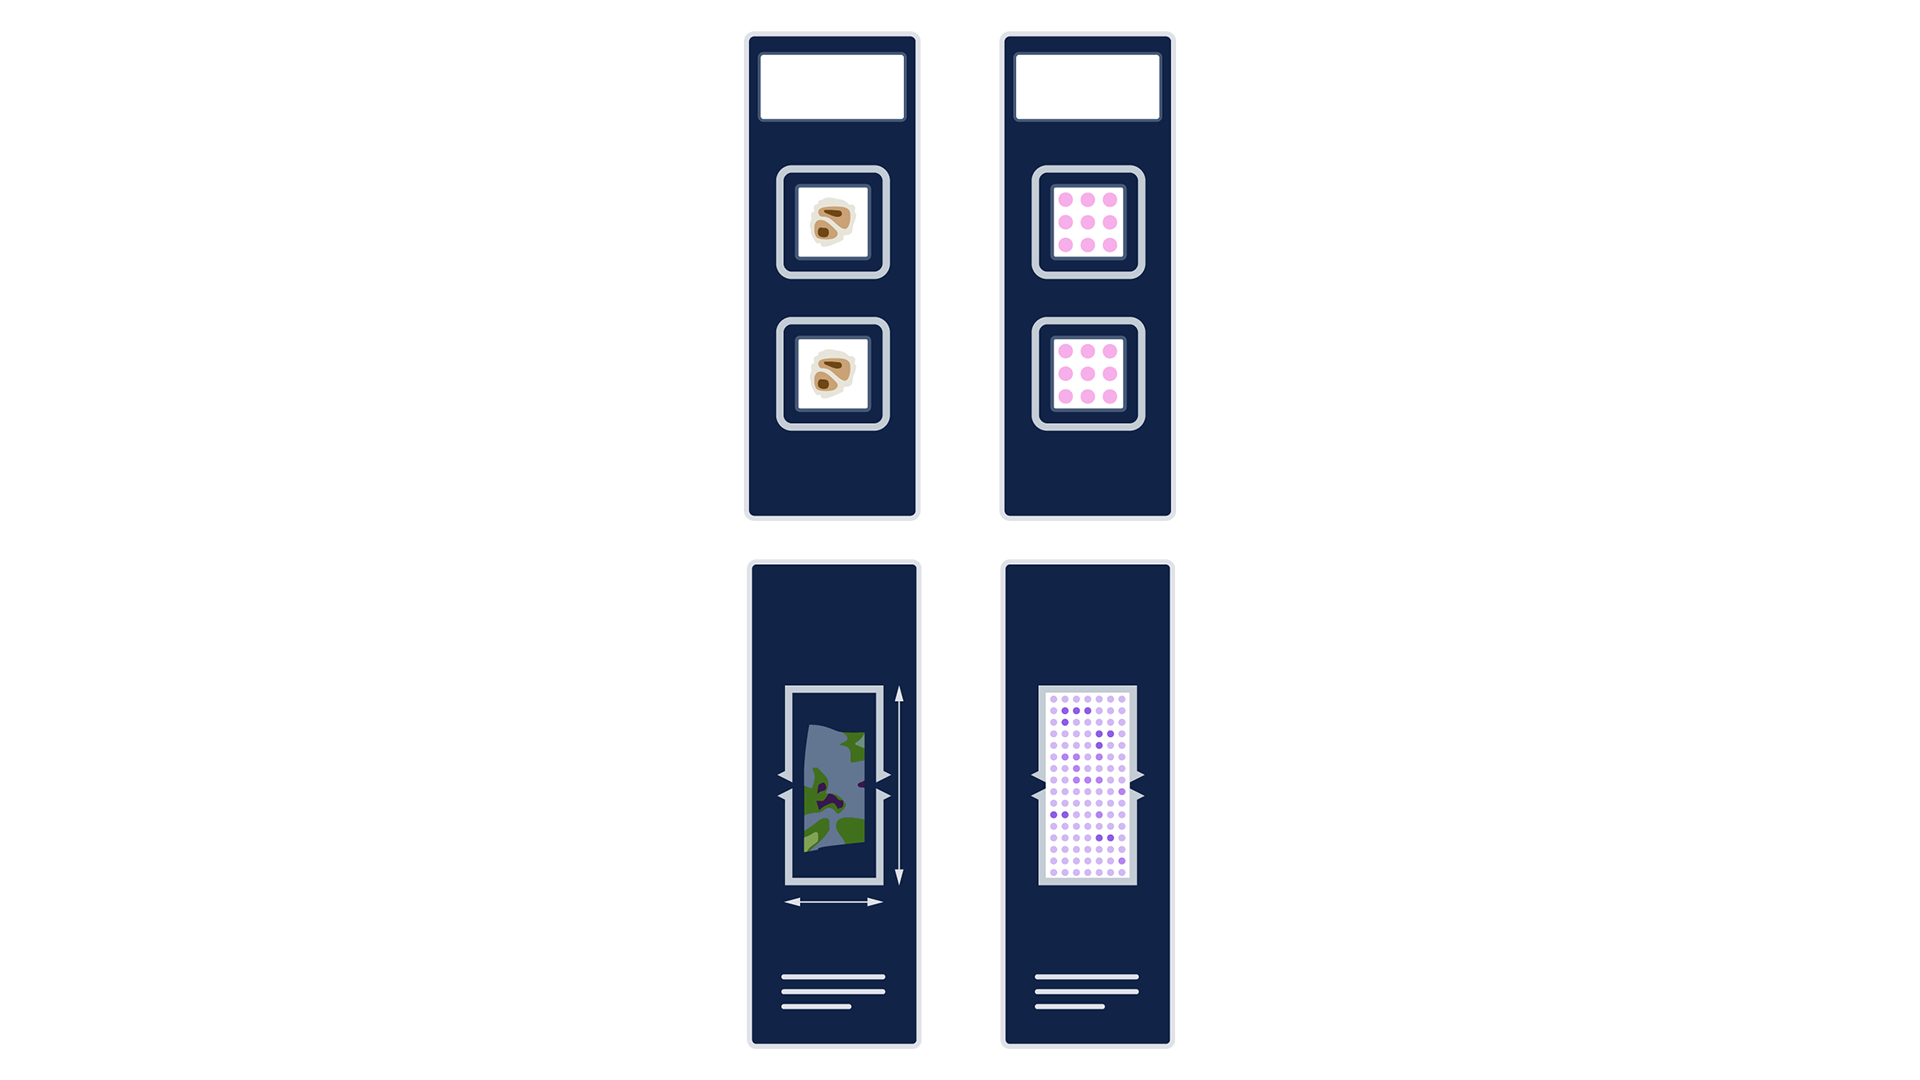
The first is that the extra time required does not necessarily scale linearly with each additional sample. The second is that tissue samples can be arranged on the Capture Area (Visium HD) or imageable area (Xenium Prime 5K) in a variety of ways—a single slide can contain one large sample, several medium samples, or many small samples (Figure 4).
Taking this nuance into account, it can be helpful to consider these technologies in terms of slides run (rather than strictly the number of samples analyzed).
As an NGS-based technology, the output of each Visium HD run is a sequencing library. This allows you to batch a large number of samples in a single NGS run. Thus, Visium allows you to scale up by batching sequencing libraries from large numbers of samples. The Visium HD workflow itself requires roughly 8 hours of hands-on time over 2–3 days, and can be parallelized depending on the availability of samples, personnel, thermal cyclers, and CytAssist instruments.
Xenium Prime 5Kis an imaging-based technology, and the most time-consuming part of any single cell spatial imaging experiment is the imaging. While we’ve taken great pains to optimize these steps, each Xenium run requires its own image acquisition and analysis, which is most analogous to the sequencing step in the NGS-based Visium HD workflow.
For the imaging-based Xenium, tissue analysis time and throughput is a function of both total tissue area analyzed and assay plexity. For any of our panels run with multimodal cell segmentation, we estimate 6 hours of hands-on time and 2 to 3 days of slide preparation, which can be parallelized depending on the availability of samples, personnel, and thermal elements. Image acquisition and analysis of 472 mm2 of tissue can take up to 6 days, though you have the option to reduce run time by analyzing smaller tissue areas.
Takeaway: We recommend you estimate each tissue sample’s size, use that to determine the total number of slides you would need to run on each technology, and leverage that to determine a rough total analysis time.
Data analysis methods
The final data outputs for Xenium Prime 5K and Visium HD are, respectively, imaging- and sequencing-based. Both platforms offer intuitive data visualization and analysis pipelines, as well as easy compatibility with third-party tools for you to get the most out of your data.
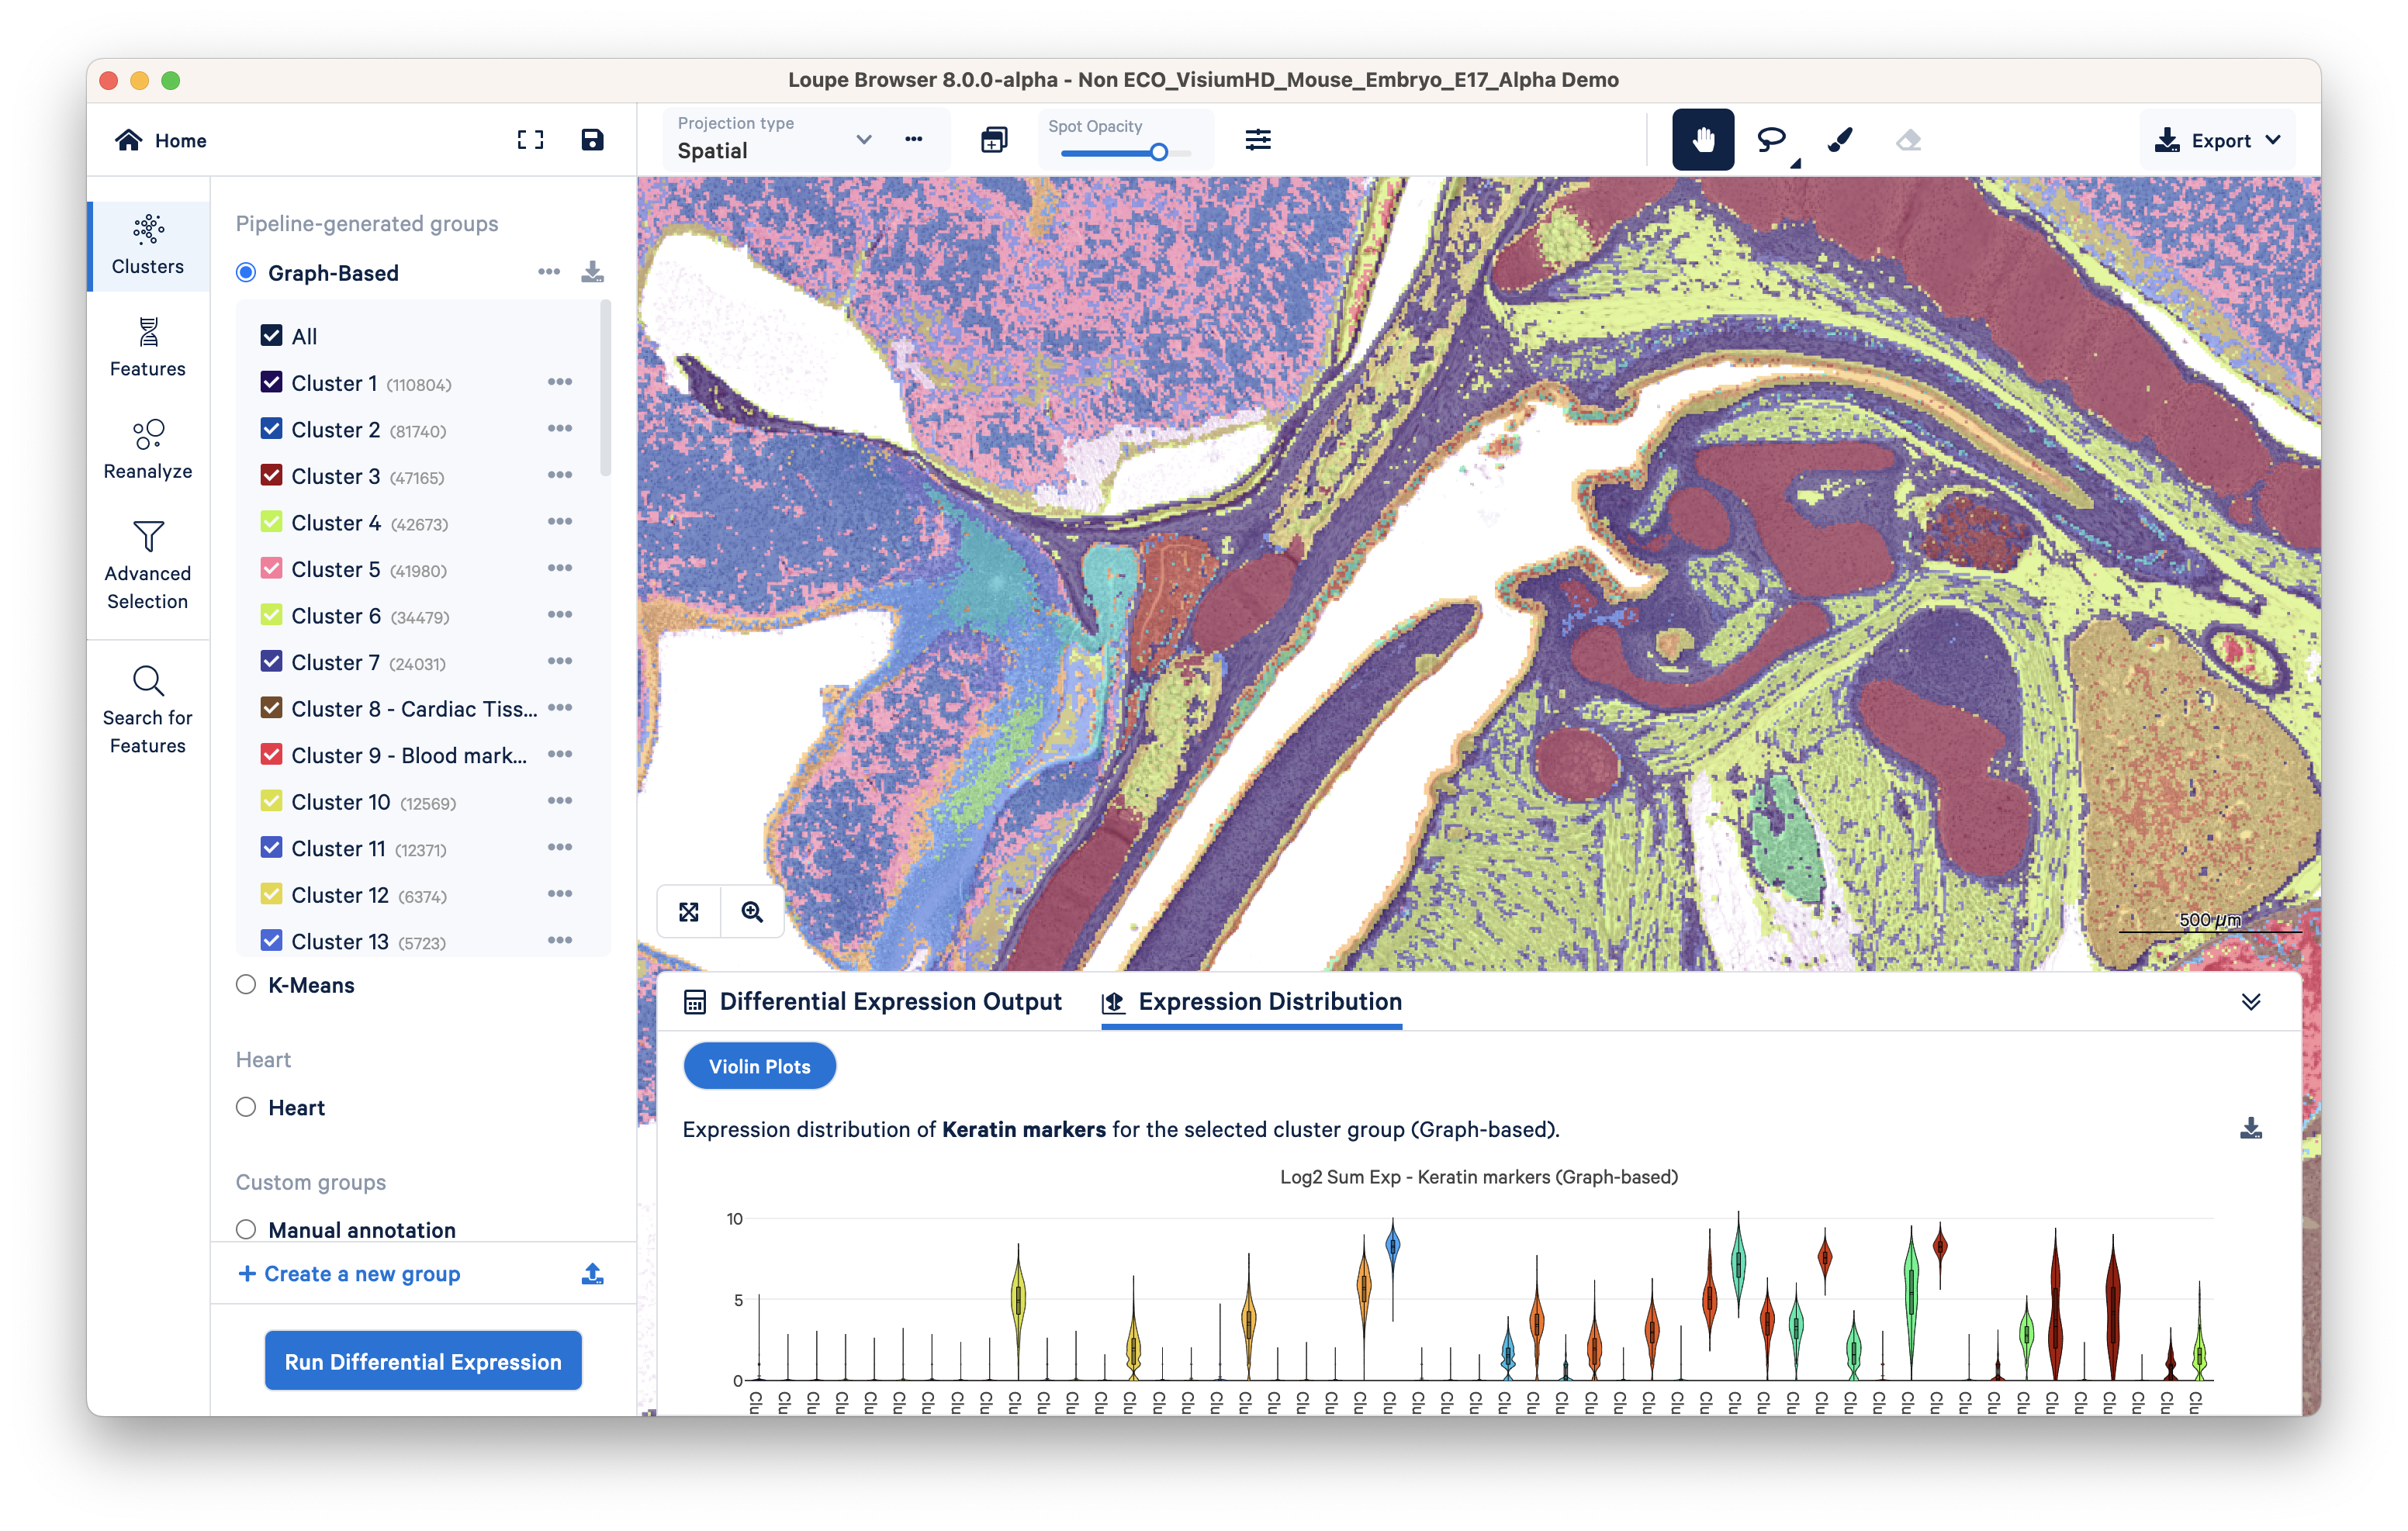
Once sequencing of your Visium libraries is completed, the data is run through the Space Ranger analysis pipeline. These outputs (which include, but are not limited to, file formats such as feature barcode matrix (h5) and tissue positions (parquet)) are then visualized with the Loupe Browser, which allows for differential analysis and reclustering of Visium clusters (Figure 5).
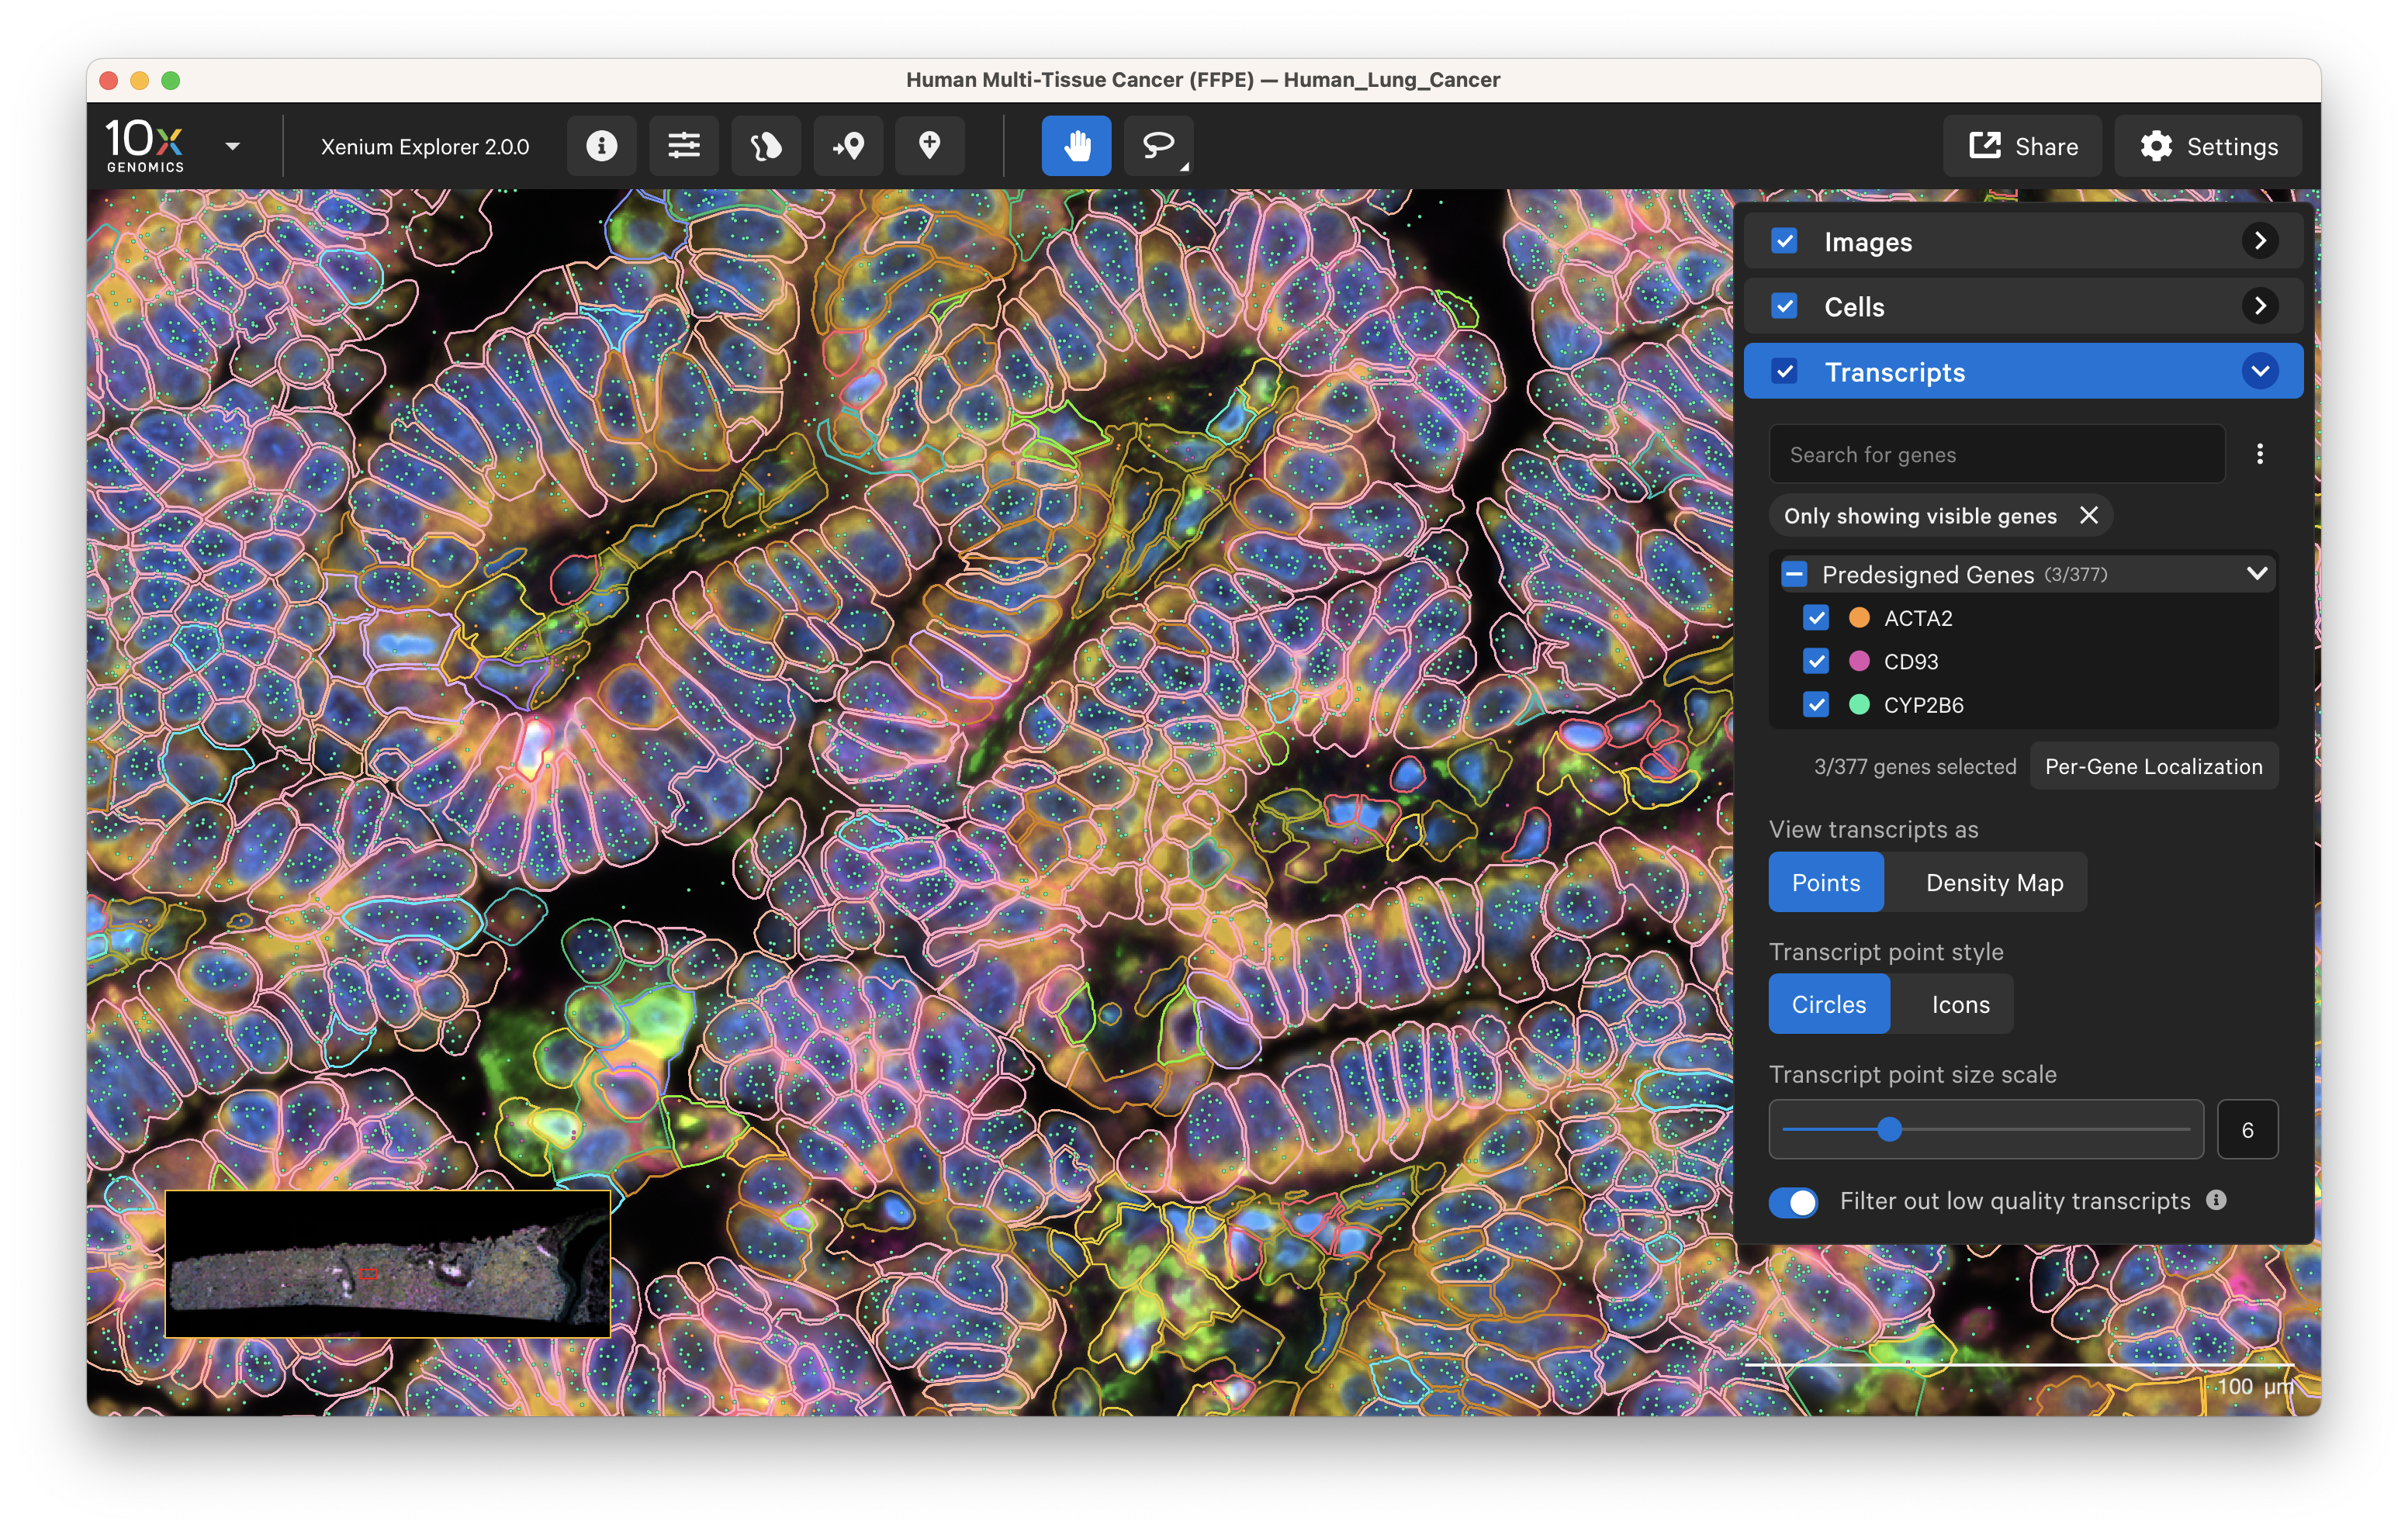
Xenium data is analyzed onboard the instrument in parallel with the image acquisition and analysis steps, resulting in interpretable data that’s ready right after your run is done in formats like ome.tiff (images), .parquet, .zarr, and .csv (transcript). These outputs are then visualized on Xenium Explorer (Figure 6).
As we understand the importance of use cases that go beyond our provided software solutions, we ensure both platforms offer data outputs in a variety of common and open-source file formats for easy third-party analysis. Examples of available third-party tools can be found in our Visium and Xenium Analysis Guides.
Takeaway: Both Xenium Prime 5K and Visium HD feature integrated and intuitive data visualization and analysis pipelines, file outputs in a variety of open formats, and easy compatibility with third-party analysis tools.
Final conclusions and taking your next steps into spatial
Both these technologies let you see your tissue with greater clarity, depth, and breadth than ever before. We’ve summarized the main points into the table below, and hope this has helped provide some insights into the strengths of each approach. Feel free to jump to the Visium HD and Xenium pages to learn more!
About the author: