How mapping the spatial biology of the tumor microenvironment can benefit cancer drug discovery and development
Editor’s Note: Since the release of this blog in November, 2024, the pre-print originally featured has been published in Nature Genetics. Explore the full paper here.
Comprehensive spatial analysis of the tumor microenvironment (TME) of cancer research samples has huge potential to reveal the cellular and molecular mechanisms of disease or resistance and, ultimately, point to putative drug targets for therapeutic development.
But where should you start when it comes to bringing spatial transcriptomics methods into your projects? It can be helpful to evaluate these approaches and their value for cancer drug development through examples of how other scientists have used them, particularly with human tumor samples from clinical settings.
This blog explores the emerging applications of spatial transcriptomics to TME research and cancer therapeutic development. It highlights a recent 10x Genomics publication from Nature Genetics (1) that used Visium HD and Xenium In Situ, combined with Flex Gene Expression and Universal 5' Gene Expression, to study human FFPE colorectal cancer samples. The study exemplifies the power of spatial transcriptomics to reveal the complex and therapeutically relevant spatial relationships and interactions among tumor and immune cells in the TME and offers novel analysis approaches to interrogate the biology of tumor boundaries.
Jump ahead to findings from the paper, or keep reading to explore seven ways spatial transcriptomic analysis supports cancer drug discovery and development.
How does comprehensive spatial mapping of the TME support cancer drug discovery and development?
“Examining the presence and arrangement of cellular components in patient tissue samples is the foundation of diagnosing, staging, and forming treatment decisions for most solid tumors.” — Katie Shumake, Stanford Medicine News (2)
This bold claim doesn’t go unjustified. A number of research examples that leverage high-resolution spatial transcriptomics to map the ‘presence and arrangement’ of tumor and immune cells within the TME have powerfully demonstrated the emerging utility of spatial biology methods for translational oncology.
For example, a recent study leveraged Xenium In Situ to characterize tumor heterogeneity between breast cancer subtypes in clinical research samples to identify T-cell and macrophage interactions with tumor cells that served as biomarkers of positive immunotherapy response (3). Likewise, in a phase 1b clinical trial of the neoadjuvant cabozantinib and the PD-1 inhibitor nivolumab against liver cancer, researchers leveraged Visium Spatial Gene Expression to identify heightened B-cell activity in tumor-adjacent immune cell regions as a new biomarker for positive therapeutic response (4).
Yet another study used Visium to reveal the presence of a rare prostate cancer subtype co-existing with a more common subtype in the same tumor sample, providing guidance on the development of future diagnostic assays and treatment options (5). Finally, scientific leaders at AACR 2024 confirmed the place of spatial biology in TME research as they discussed the role of spatial transcriptomics data and computation to better predict tumor progression and therapeutic response.
There is a wide and innovative range of applications with high-resolution spatial transcriptomics technology to TME research that promise to enhance cancer drug discovery and development. The following list of applications, while not comprehensive, can serve as a starting point as you consider where spatial transcriptomics fit into your research goals:
- Enhanced target identification: Discover novel cell types and interactions specific to disease states, potentially uncovering new drug targets.
- Improved understanding of disease mechanisms: By mapping cell types and interactions in their spatial context, gain deeper insights into how diseases progress and identify key drivers of pathology.
- More physiologically relevant drug screening: Understanding the spatial organization of cells in diseased tissue helps design more accurate in vitro models for drug screening (such as generating three-dimensional organoid models that capture spatial elements of the tumor rather than simple 2D 'sheets' of cells).
- Biomarker discovery: Spatial transcriptomics can identify location-specific gene expression patterns that could serve as novel biomarkers for disease progression or drug response.
- Optimized drug delivery strategies: Knowledge of the spatial distribution of target cells can inform the development of targeted drug delivery systems.
- Better prediction of drug efficacy and side effects: Understanding the complex cellular interactions in diseased tissue can help predict both on- and off-target effects of potential therapeutics.
- Reduced attrition rates: A deeper understanding of disease mechanisms and cellular interactions could lead to better-informed drug development decisions, potentially reducing costly late-stage failures.
Exploring the heterogeneity of colorectal tumor biology with high-resolution spatial technologies
A recent Nature Genetics publication authored by 10x Genomics scientists served as a helpful example of how spatial biology tools can be applied to translational research into the TME. The study leveraged a cohort of human FFPE colon adenocarcinoma samples, including FFPE blocks from tumors and normal tissues adjacent to the tumors (NATs). Diving deeply into these samples, the team went from a “big picture” view of the spatial organization of cell types in the TME through Visium HD whole transcriptome analysis to a more focused, structure-specific analysis of the composition of the tumor boundary, and finally to a highly refined view of the interactions between macrophage cells, T cells, and tumor cells with targeted Xenium analysis. These levels of resolution into the biology of the TME inspired an analogy that we find helpful:
Exploring the tumor microenvironment can be like exploring a city. Seeing the entire city, especially from an aerial view, is dazzling and informative. You can see the various parts and structures that compose the whole—skyscrapers, bridges, parks, rivers—from the highest level to understand its broad organization. A digital map that can zoom out to see the big picture of the city, as well as zoom in to navigate its streets and buildings, all the way down to the bricks that make up these structures, offers the complete experience.
Starting with a picture of the whole transcriptome
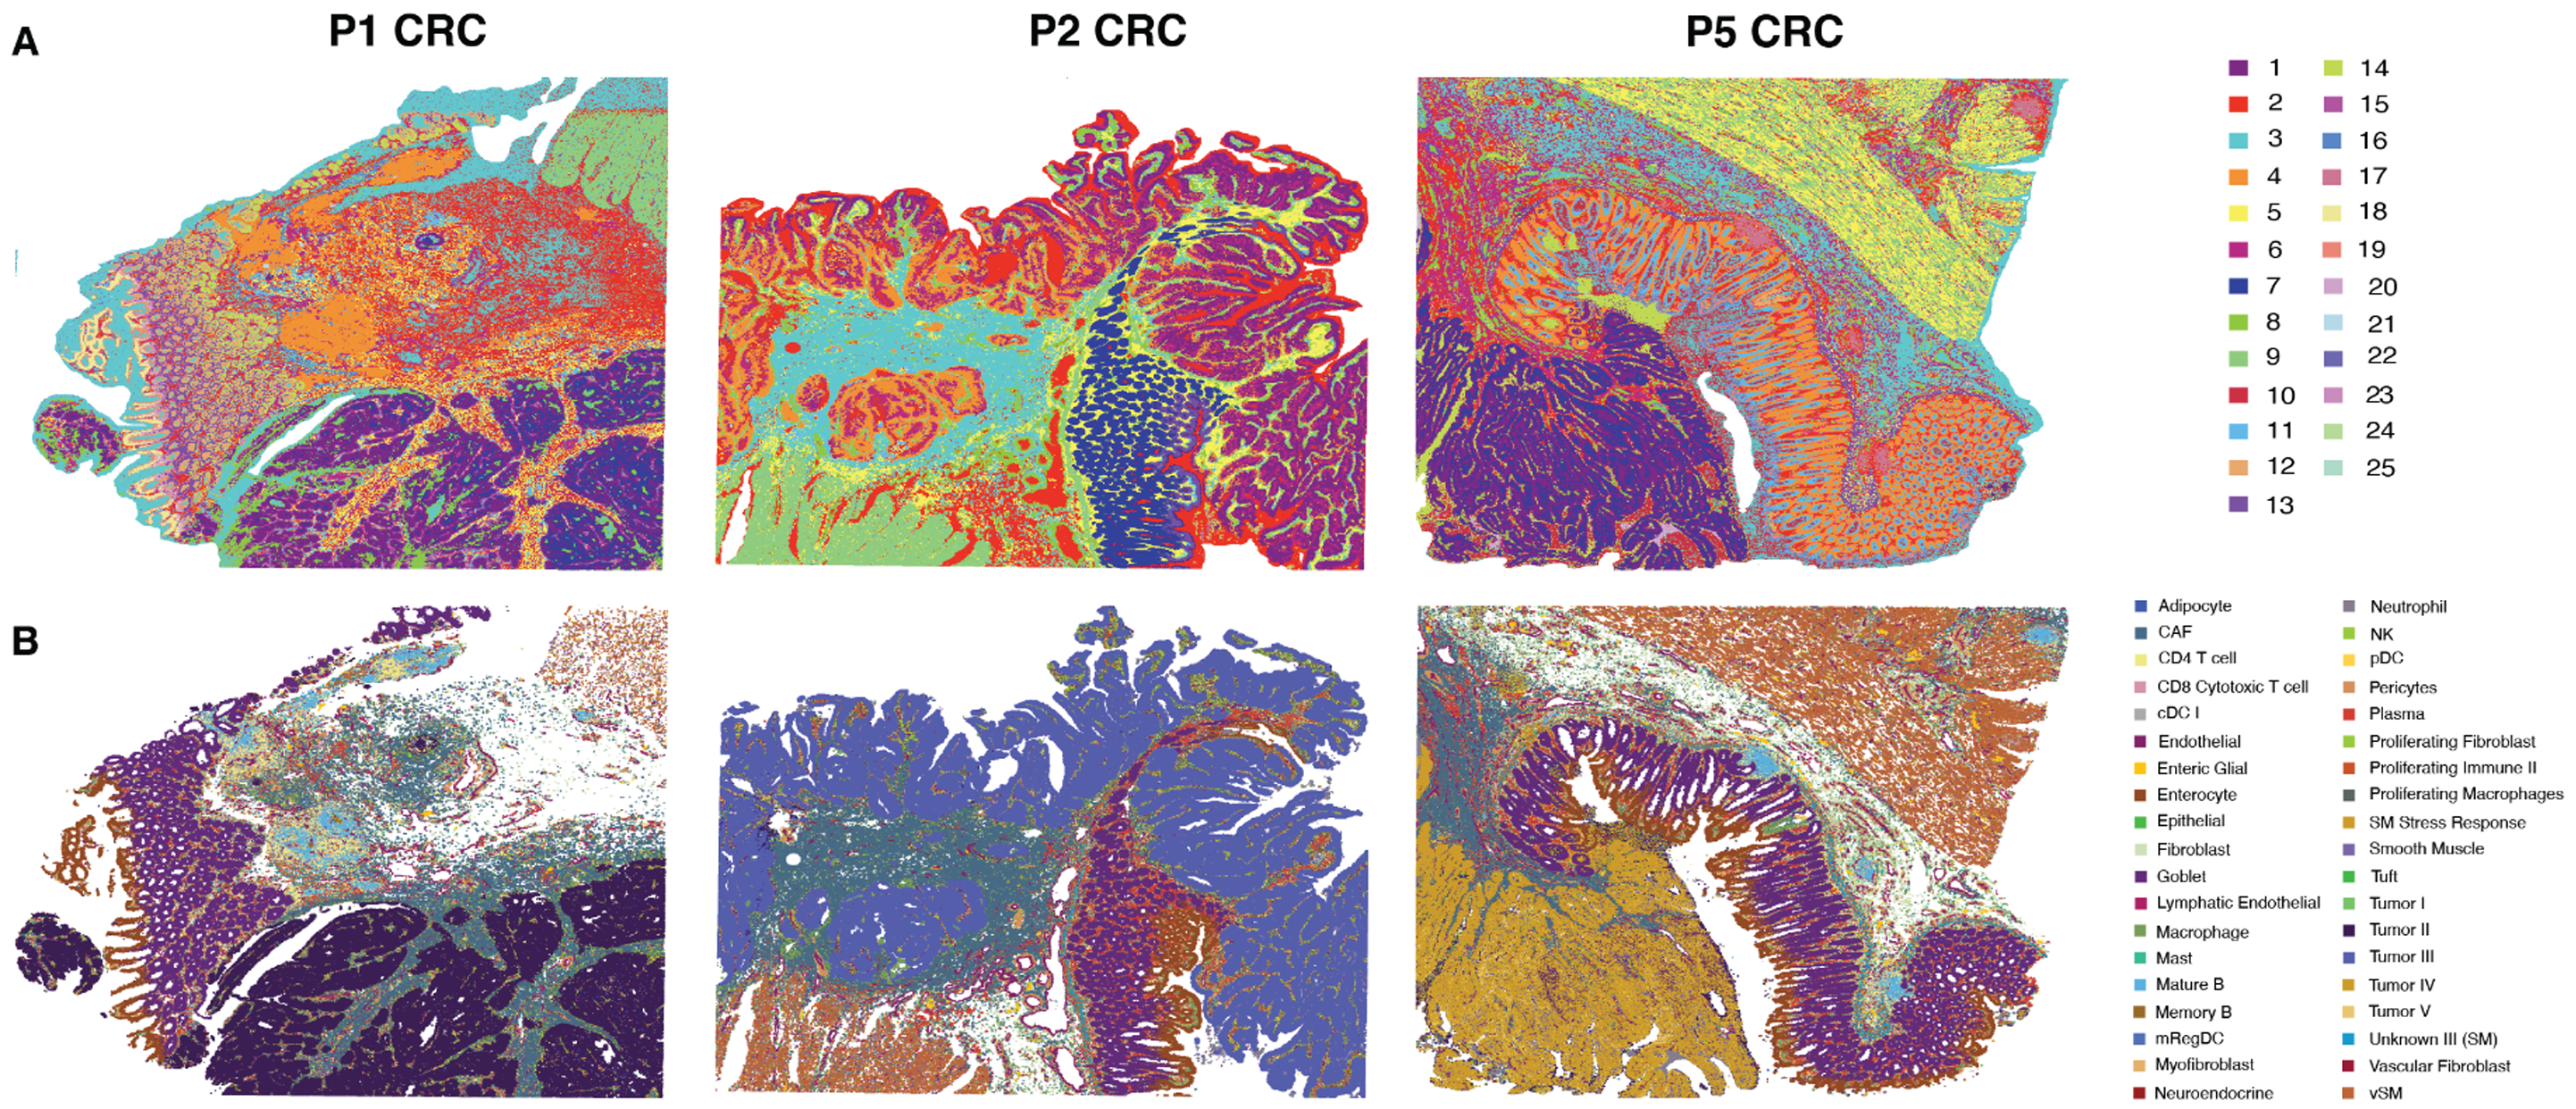
10x Genomics scientists were able to create this same kind of map with three unique patient colorectal tumor samples using Visium HD, leveraging a novel integrated analysis technique to combine the three samples into a single dataset. Visium HD provided a view of spatial gene expression across the tissue sections at single cell–scale resolution. Same-section H&E images were then overlaid with the gene expression data, enabling alignment of morphological and molecular features. This comprehensive view of the spatial organization of the tumor microenvironment was enabled by: 1) assigning cell types according to the transcript composition of 8 µm x 8 µm bins, a default size that offers single cell–scale spatial resolution (Figure 1A); and 2) leveraging a single cell RNA sequencing reference dataset taken from the same samples to predict (or deconvolute) the cell types within those same bins (Figure 1B).
[Explore an introductory overview of how Visium HD works here.]

To ensure their single cell reference dataset closely represented the cell types in the tissue sections used for spatial analysis, the team sampled serial tissue curls (sections adjacent to those used for Visium HD) from the same three FFPE blocks, in addition to curls from five other CRC and NAT blocks. They then leveraged Flex Gene Expression to perform single cell profiling. While unsupervised clustering from Visium HD data alone provided meaningful results, leveraging a single cell reference dataset provided the added benefit of a consistent strategy for cellular annotation across heterogeneous patient tumor samples and supported identification of cells that had a more random organization or very small cells like B and T cells. Additionally, deconvolved Visium HD data revealed that each of the three patient samples had a unique “major” (or most abundant) tumor cell type, confirming the reality of intertumoral heterogeneity that may affect a patient’s response to therapy.
Zooming in to study the tumor border
Spatial transcriptomics approaches such as Visium HD are valuable because they allow researchers to look even closer at the cellular composition of specific structures within the larger tissue architecture, which may reveal important insights about the cellular dynamics driving specific qualities of that tumor. Subsequently, the 10x team focused their spatial analysis on the tumor–immune cell interactions at the tumor boundary, as these cellular dynamics can provide insights into the invasive potential of a tumor or the capacity for immune infiltration and may, therefore, have important implications for disease progression and therapeutic response.
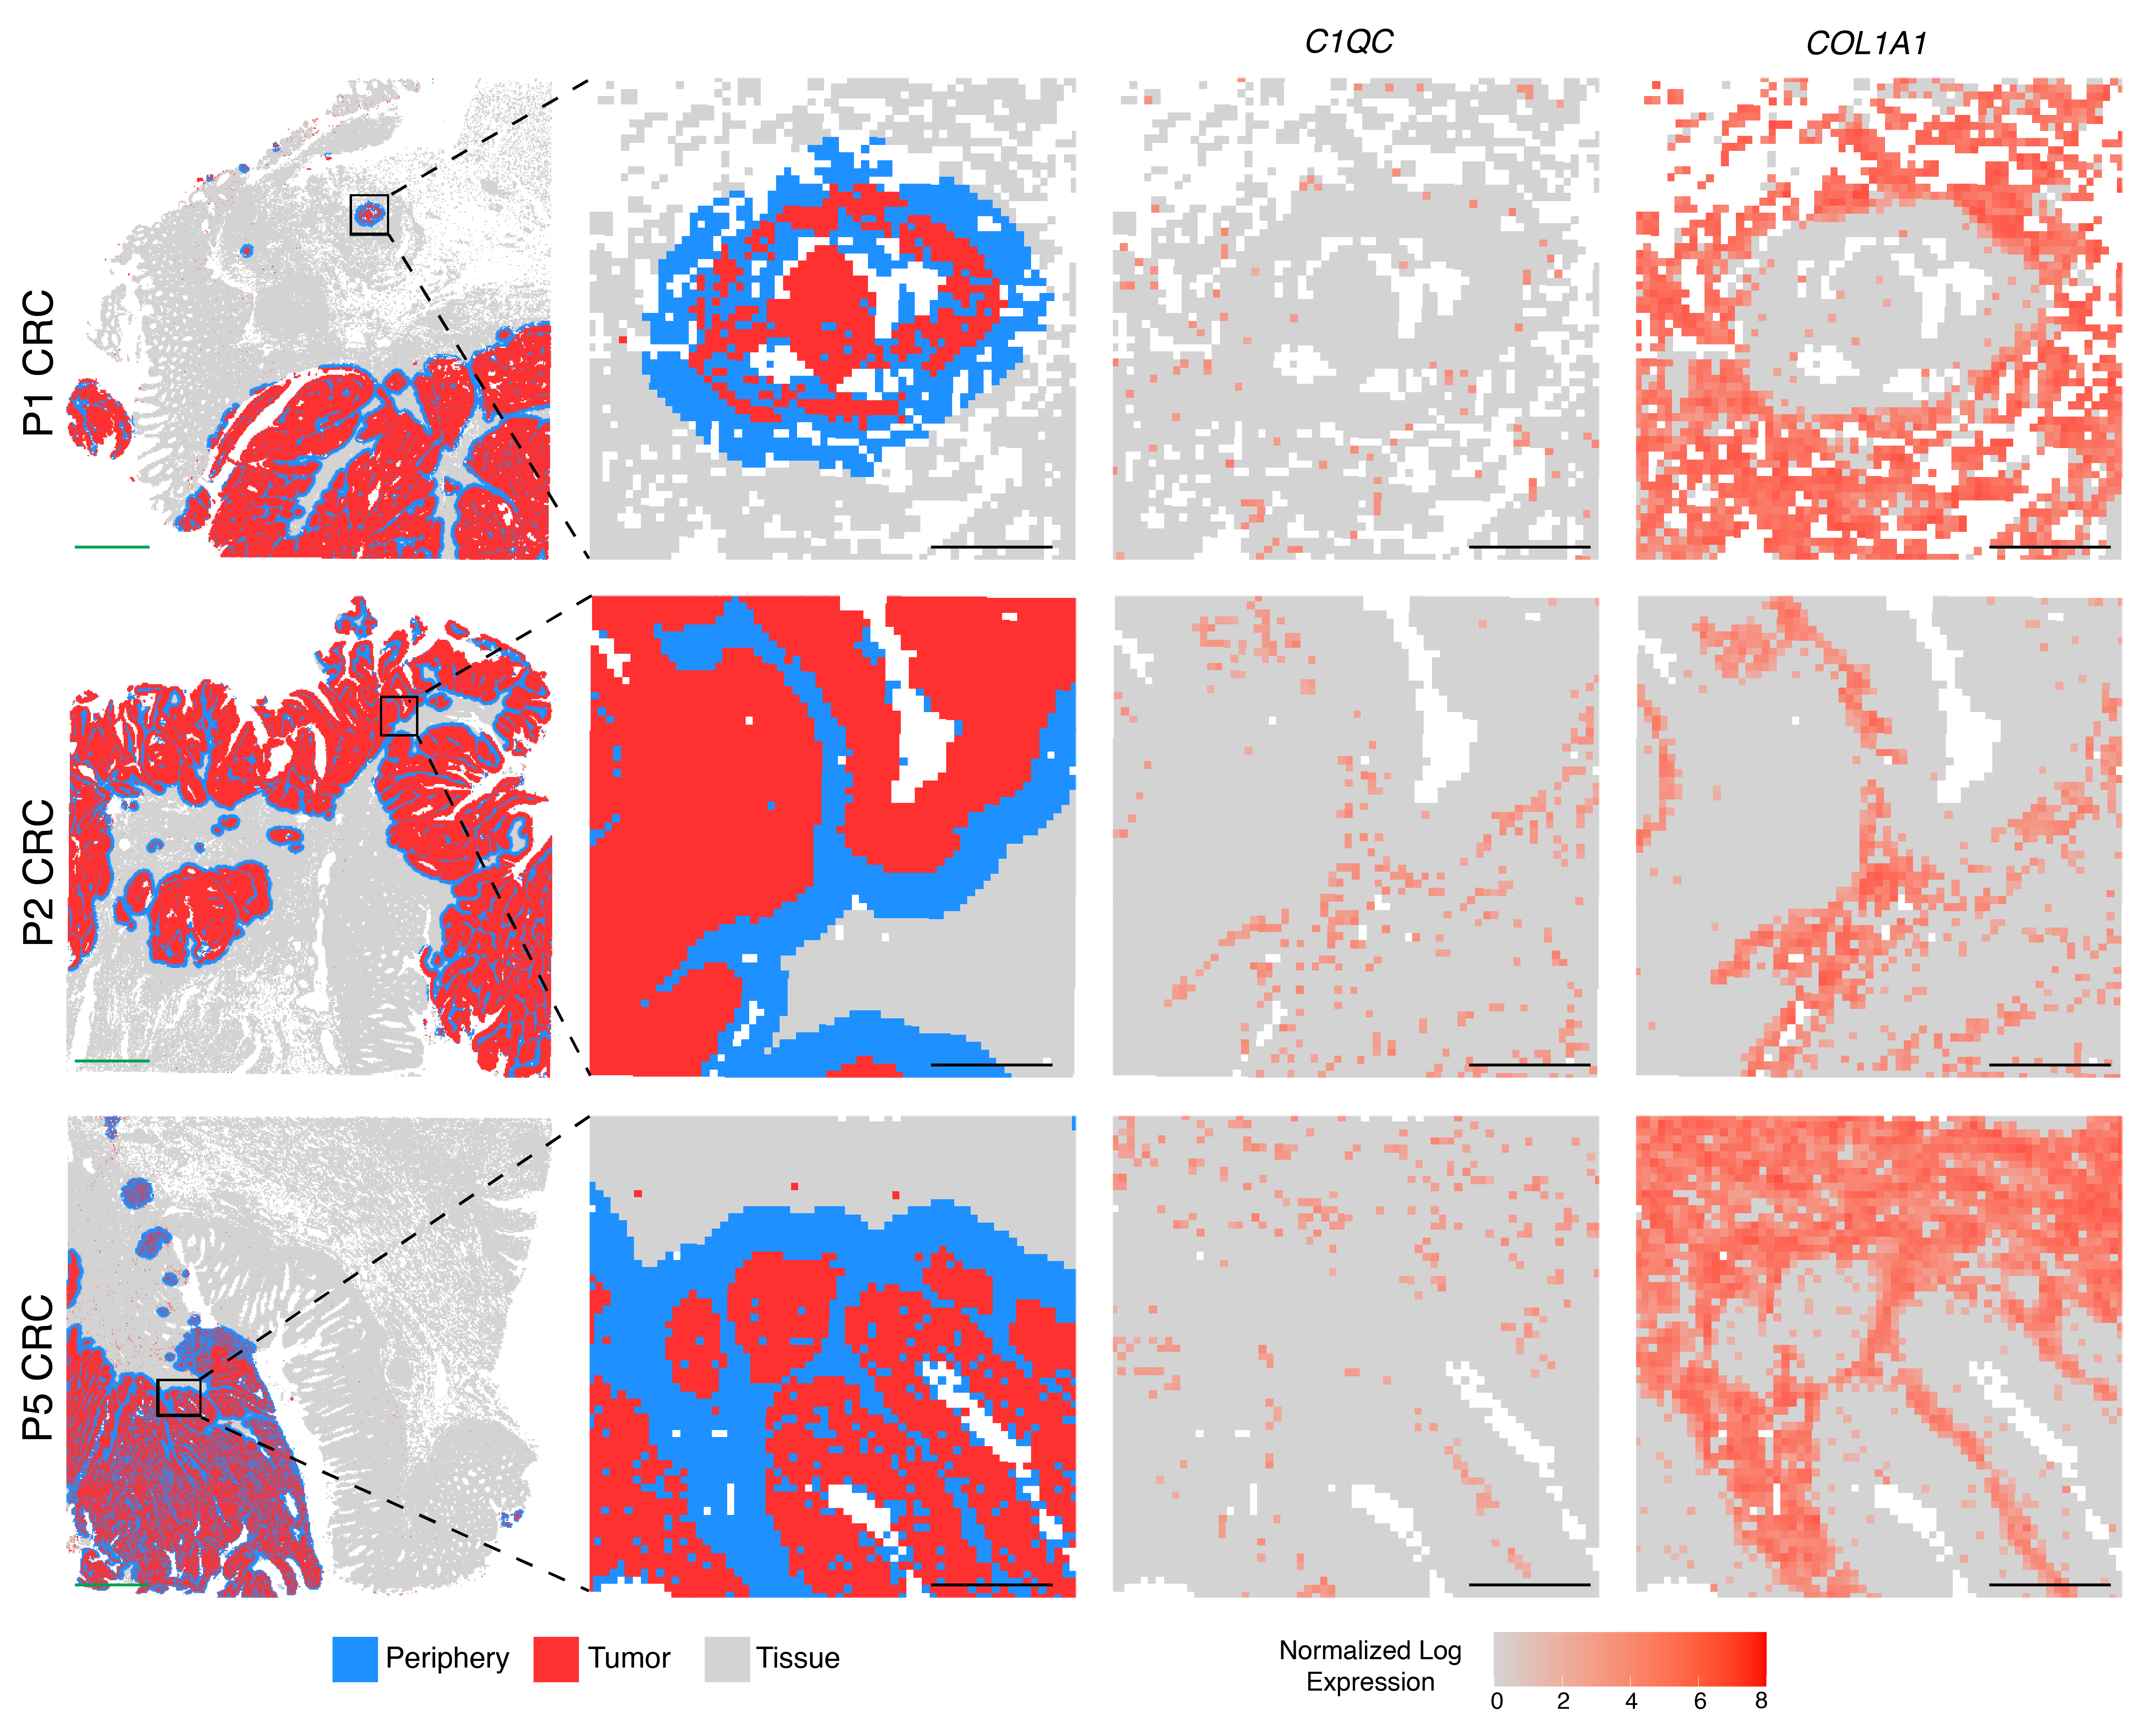
Since Visium HD data allowed for single cell–scale resolution, the team used a distance-based analysis method to resolve the cellular composition of the tumor boundary by selecting all barcoded 8 µm bins within 50 µm of periphery tumor cells, then quantifying the composition of cell types in those regions. This revealed that cancer-associated fibroblasts were the most prominent cell type overall in the border region, while macrophages were the most prominent immune cell type. The team confirmed this result by localizing fibroblast and macrophage populations according to their known markers (Figure 2).

The close association between macrophages and tumor cells in the tumor boundary led 10x scientists to take a closer look at this immune cell population. Taking advantage of the whole transcriptome data provided by Visium HD and their single cell reference dataset, the team performed independent unsupervised clustering of the 8-µm bins in the tumor border. Their analysis showed that some cells in the border were typed as macrophages. They further determined that two distinct macrophage subpopulations were represented in these clusters, which were characterized by the expression of either SELENOP or SPP1 genes. They also noted that SELENOP+ macrophages expressed pathways involved in TNF-α signaling via NFK-β (known to play a role in tumor promotion (6)). SPP1+ macrophages expressed genes involved in coagulation, cholesterol homeostasis, and upregulated KRAS signaling (the latter of which is often overly active in cancers, causing uncontrolled cell growth and survival (7)).
Spatial niche analysis suggested that these macrophage subpopulations localized in tumor regions with different overall gene expression profiles, like unique neighborhoods with a distinct character—different architecture, restaurants, and culture—though in the same city.
Both macrophage “neighborhoods” had seemingly pro-tumor gene expression signatures, in this case. Specifically, SELENOP+ macrophages appeared to co-localize with tumor cells that upregulated the REG family genes, which are typically associated with metastasis, advanced tumor stage, and poor prognosis in colorectal cancer. SPP1+ macrophages co-localized with tumor cells expressing TGFBI, also associated with poorer prognosis (1).
Using LIANA, a cell–cell communication analysis tool, the team also inferred ligand-receptor interactions between the macrophage populations and tumor cells and T cells within the tumor periphery region (Figure 3). This demonstrated that SPP1+ macrophages interacted with tumor and T cells through the CD44 receptor, a known player in tumor initiation and progression (8). Meanwhile, SELENOP+ macrophages interacted with tumor cells and T cells by influencing protumor metabolic pathways and immune cell stimulation.

This detailed knowledge of the spatial cellular relationships shaping the character of the tumor microenvironment points to possible mechanisms influencing disease progression or therapeutic response. The team extended their spatial analysis of macrophage diversity to the whole tissue sections, revealing four distinct macrophage subpopulations across the three samples. This provided further data points to understand the roles these subpopulations might play in their local context, whether driving new tumor fronts or maintaining a healthy tissue composition (Figure 4).

Deep phenotyping of macrophages and T cells
Macrophages were only one immune cell type of interest shaping the tumor microenvironment. The team next sought to explore the localization and activity of T cells in these CRC samples, particularly in the tumor boundary, as the ability to recruit tumor-infiltrating lymphocytes has implications for immunotherapy in solid tumors.
First, using Visium HD data, they identified regions of the CRC samples enriched in CD4+ or CD8+ T cells, then performed nuclei segmentation and assigned transcript data to nuclei from the corresponding 2-µm bins located within the nuclei polygons. This revealed a sparse scattering of CD8A and CD4 expressing T cells at the tumor boundary but not in the surrounding normal tissue, suggesting these T cells could be playing an anti-tumor role.
Then, to validate their Visium HD findings, the team used Xenium In Situ single cell spatial imaging for the CRC samples, which provided subcellular resolution of a select panel of genes. This analysis included the pre-designed Xenium Human Colon gene expression panel (322 genes) and a custom add-on panel of 100 additional genes targeting immune cells identified from Visium HD data. Their experiment also leveraged the Multimodal Cell Segmentation workflow to segment cells by boundary stains and morphology. This approach allowed the team to confirm the presence of SELENOP+/STAB1+ macrophages near REG1A+ tumor cells and SPP1+ macrophages in close proximity to TGFBI+ tumor cells. Adding to these functional cellular relationships, the team also observed cancer-associated fibroblasts expressing MMP11 (a gene for an enzyme that breaks down the extracellular matrix and is associated with poorer prognosis) localized with TGFBI+ tumor cells, possibly pointing to a cellular network that drives tumor progression.
Single cell data has a powerful role in refining and directing insights from ultra-high resolution spatial transcriptomics assays like Xenium, too. To better understand T-cell activity and antigen recognition, the team used Chromium Single Cell Immune Profiling (recently renamed Universal 5’ Gene Expression) to study dissociated tumor cells from clinical research samples. This revealed an expanded T-cell clonotype (11% of total) in the T-cell population from one sample (P5 CRC) that recognized a neoepitope specific to that tumor—meaning this T-cell receptor (TCR) was truly novel and had not arisen from a prior infection.
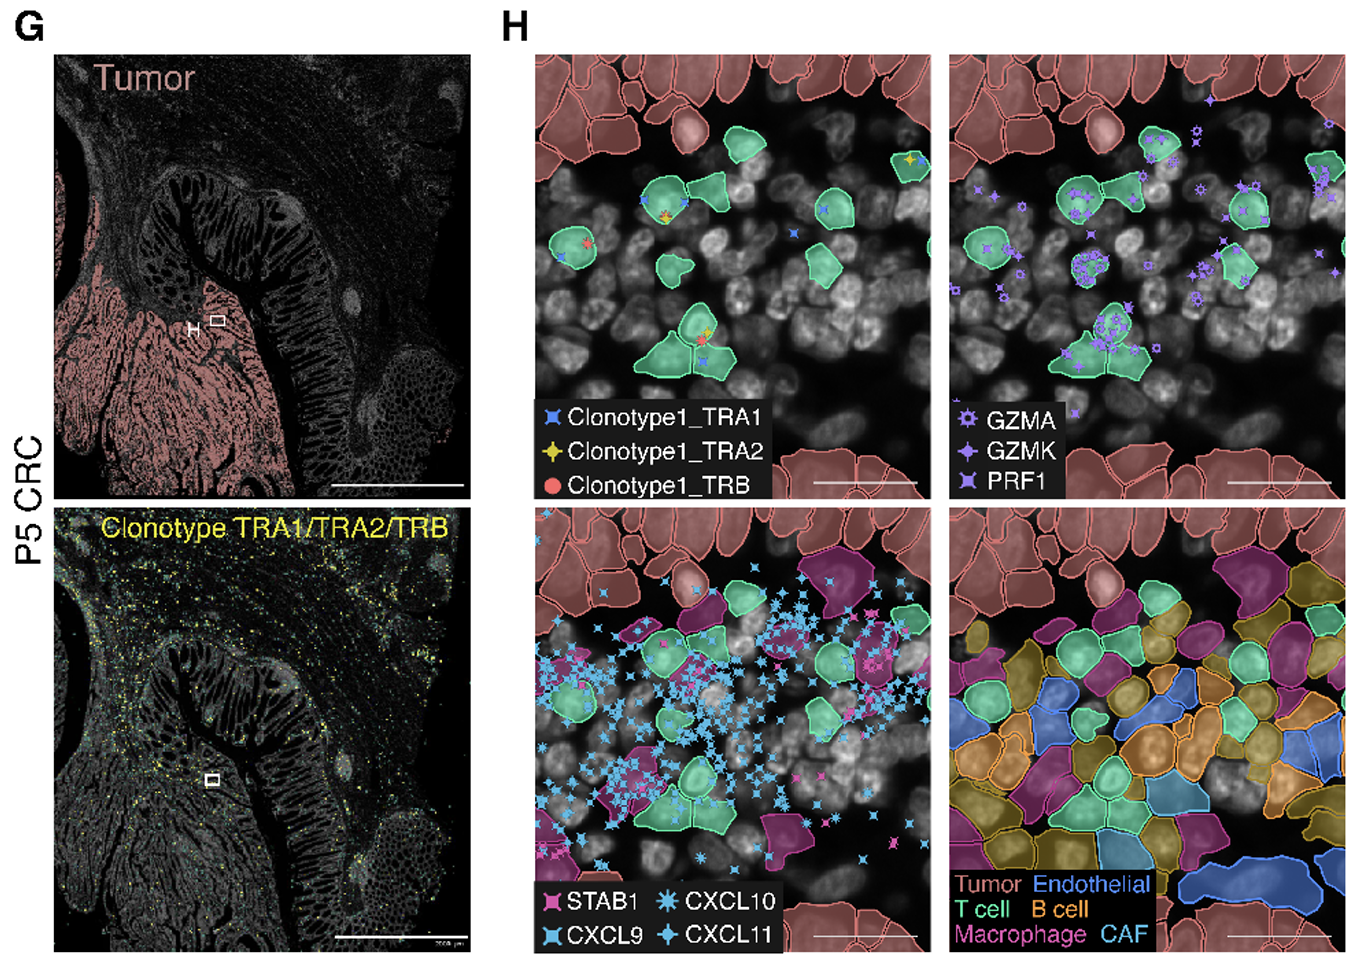
Combining this finding with the capabilities of Xenium, the team included probes targeting this clonotype’s TCR sequence in their 100-gene custom panel, which allowed them to localize the clonotype throughout the P5 CRC tumor section. They discovered clusters of these T cells close to tumor cells within gut-associated lymphoid tissues and confirmed by gene expression signatures that they were CD8+ cytotoxic T lymphocytes. Moreover, these T cells localized near CXCL9/CXCL10/CXCL11 chemokine foci, as well as STAB1+ macrophages*, B cells, and endothelial cells—cell groups which likely contributed to the expression of these chemokines that subsequently recruited immune cells to the tumor.
*SELENOP was not included in the Xenium panel, therefore STAB1 was used to locate the macrophage populations in this dataset (see Figure 5H).

These findings tell a more complete story of the war between pro- and anti-tumor factions in the tumor microenvironment of this particular sample. While previous data suggested a predominantly pro-tumor role for the two macrophage subpopulations present in the TME, here the team identified a macrophage subpopulation that represented the primary source of immune cell-recruitment chemokines and thus likely played an anti-tumor role.
The ability to deeply profile these competing niches within the same tumor using single cell and spatial transcriptomics tools represents an important advancement in our understanding of cancer biology and the underlying cellular and molecular mechanisms influencing tumor progression and response to therapy. These findings also present opportunities for cancer drug development, such as targeting macrophages to switch them to an anti-tumor state.
Our hope is that through the insights powered by high-resolution, high-plex spatial transcriptomics tools, scientists can gain a deeper knowledge of cancer mechanisms to overcome heterogeneity and resistance, and ultimately design more effective treatments across the breadth of cancer types.
Explore our spatial biology overview page to keep learning how Visium and Xenium spatial transcriptomics tools are being used for cutting-edge research.
References:
- Oliveira MF, et al. High definition spatial transcriptomic profiling of immune cell populations in colorectal cancer. Nat Genetics (2025). doi: 10.1038/s41588-025-02193-3
- Shumake K. The promise of spatial biology in understanding tumors. Stanford Medicine News (2024).
- Wang N, et al. Spatial single-cell transcriptomic analysis in breast cancer reveals potential biomarkers for PD1 blockade therapy. Research Square (preprint) (2024). doi: 10.21203/rs.3.rs-4376986/v2
- Zhang S, et al. Spatial transcriptomics analysis of neoadjuvant cabozantinib and nivolumab in advanced hepatocellular carcinoma identifies independent mechanisms of resistance and recurrence. bioRxiv (2023). doi: 10.1101/2023.01.10.523481
- Watanabe R, et al. Spatial gene expression analysis reveals characteristic gene expression patterns of de novo neuroendocrine prostate cancer coexisting with androgen receptor pathway prostate cancer. Int J Mol Sci 24: 8955 (2023).
- Wu Y and Zhou BP. TNF-α/NF-κB/Snail pathway in cancer cell migration and invasion. Br J Cancer 102: 639–44 (2010). doi: 10.1038/sj.bjc.6605530
- Carvalho PD, et al. KRAS Oncogenic Signaling Extends beyond Cancer Cells to Orchestrate the Microenvironment. Cancer Res 78: 7–14 (2018). doi: 10.1158/0008-5472.CAN-17-2084
- Xu H, et al. CD44 as a tumor biomarker and therapeutic target. Exp Hematol Oncol 9: 36 (2020). doi: 10.1186/s40164-020-00192-0
About the author:

Blog contributors: This article has been reviewed for scientific accuracy by Michelli Faria de Oliveira, PhD, and Juan Pablo Romero, PhD, lead authors of the 10x Genomics preprint (1).


