What impacts Xenium Analyzer instrument run time?
- Transcript density: impacted by sample preparation (fresh frozen vs. FFPE), number of genes on the panel, tissue type, and disease state
- Tissue thickness
- Tissue area (up to 2.35 cm2 per slide)
- Cell segmentation staining protocol (additional 2 cycles)
The RNA quality, section thickness, expression profile, and the genes on the specific panel affect the detected transcript density. Fresh frozen tissue typically has higher RNA integrity and is sectioned to 10 µm thickness. On average, this results in a higher 2D density of detected transcripts compared to FFPE tissues.
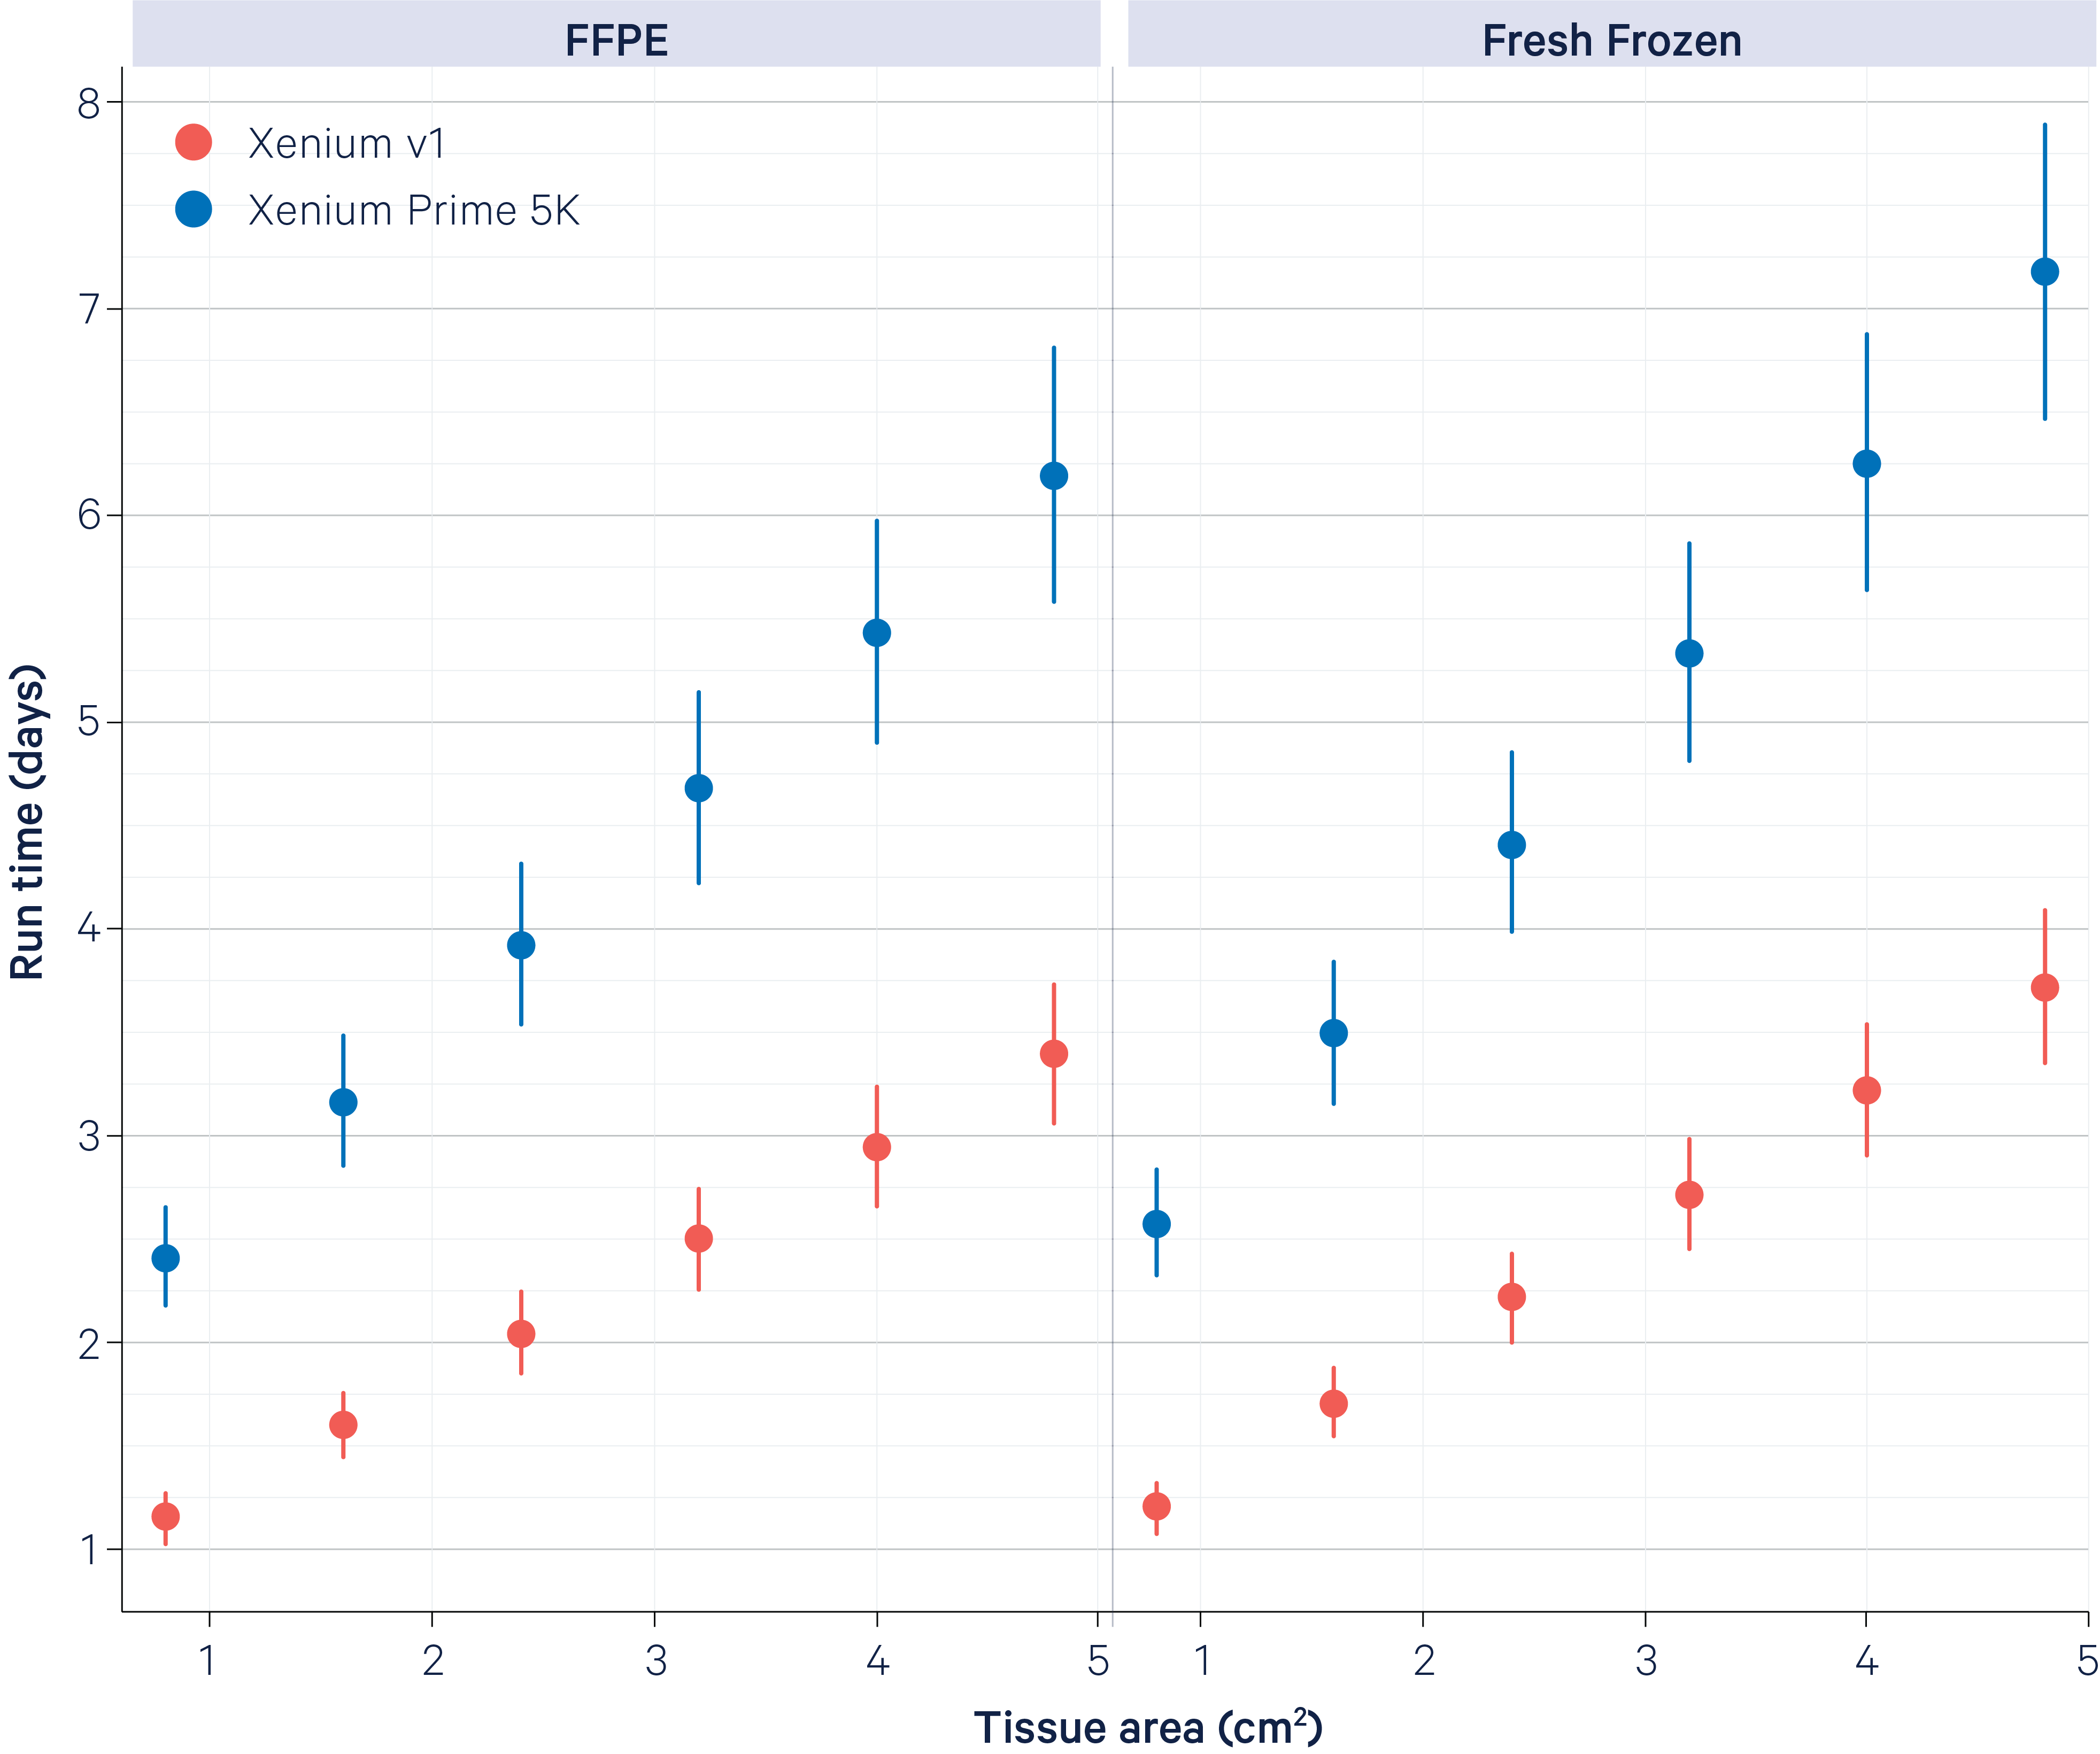
The plots below show typical instrument run times for FFPE (left) and fresh frozen (right) samples. Data generation and analysis were performed with Xenium Analyzer software v3.0 and the Xenium Onboard Analysis pipeline v3.0.
Samples were either prepared following the Xenium In Situ Gene Expression protocol ("Xenium v1"; red points) or Xenium Prime In Situ Gene Expression protocol ("Xenium Prime 5K"; blue points), both with Cell Segmentation Staining. Error bars indicate the standard deviation of runtime across a broad range of samples used in testing.
On the x-axis, tissue area is plotted per run (~2.35 cm2 x 2 Xenium Slides) to demonstrate the trend. On the y-axis, grid lines are shown in 6 hour increments.
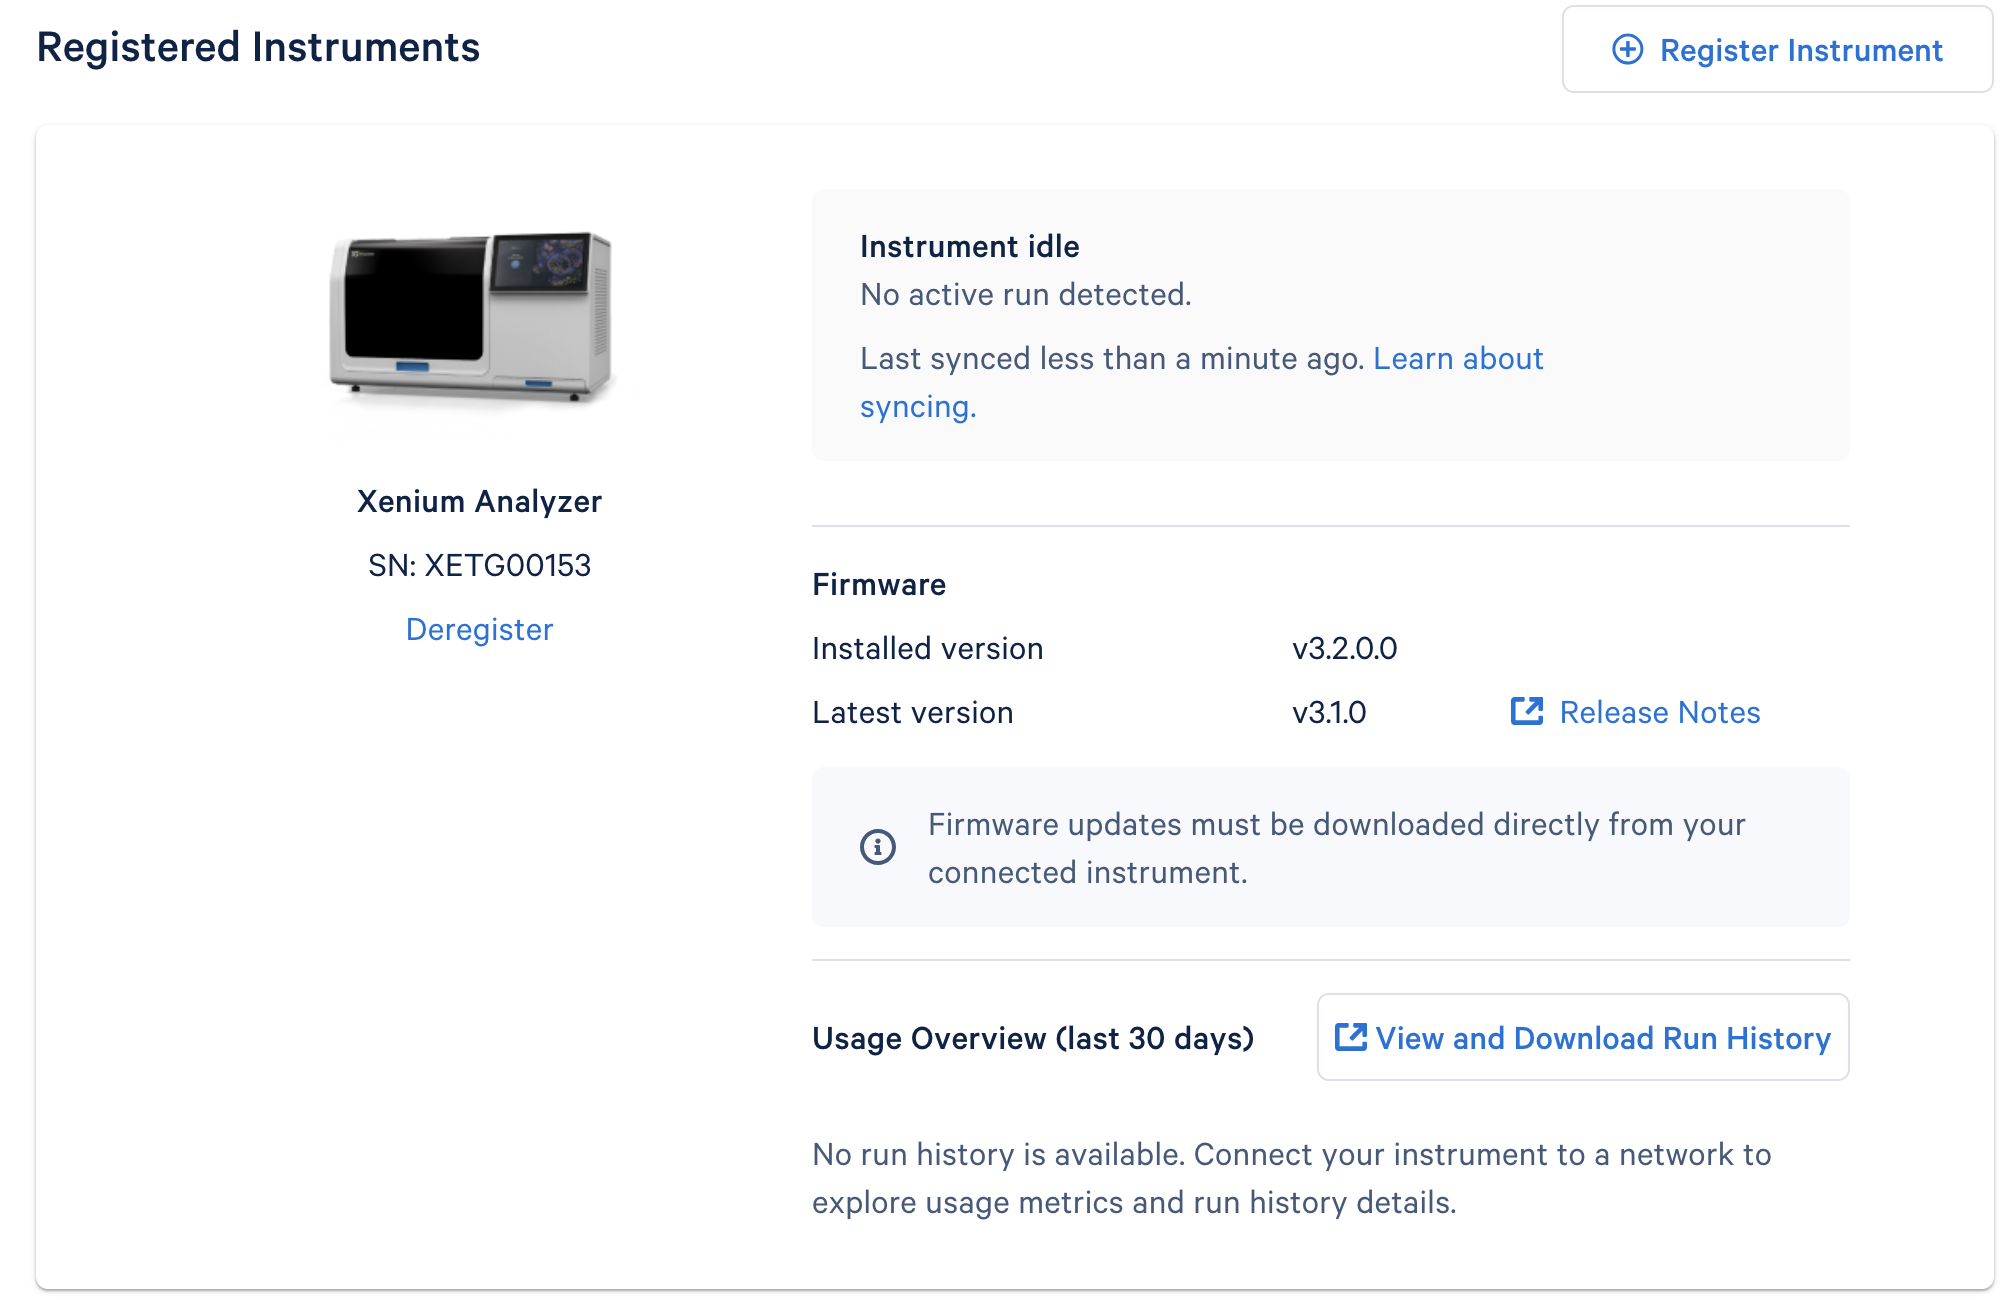
Registered users of a 10x Cloud-connected† Xenium Analyzer can monitor instrument status and run progress on the cloud.
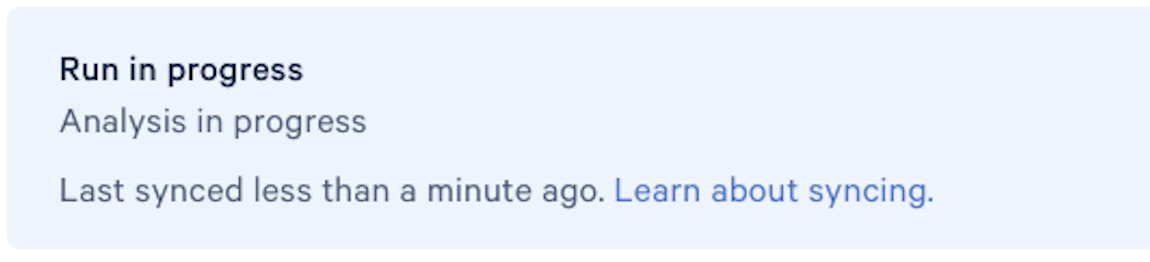
When the run completes, the status will update from "Run in progress" to "Run complete":


Overview scan progress can be tracked when starting a new run:
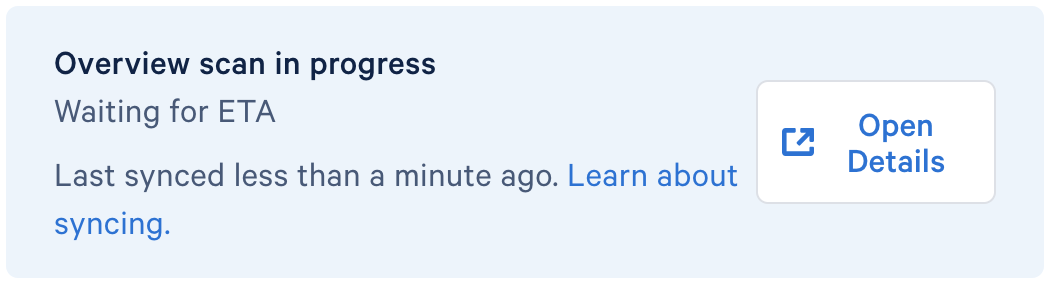

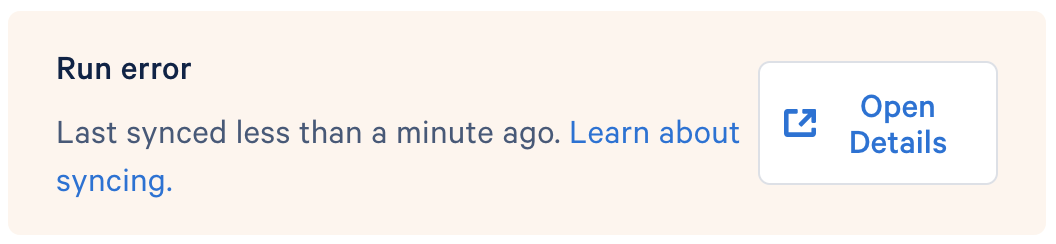
In the event of a run error, click "Open Details" to send a message to the 10x Genomics Support team for assistance:
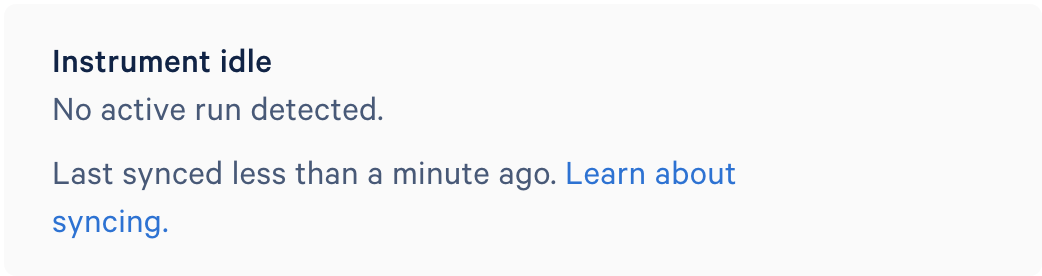
Instruments that are connected† and powered on with no run in progress will show "Instrument idle" status:
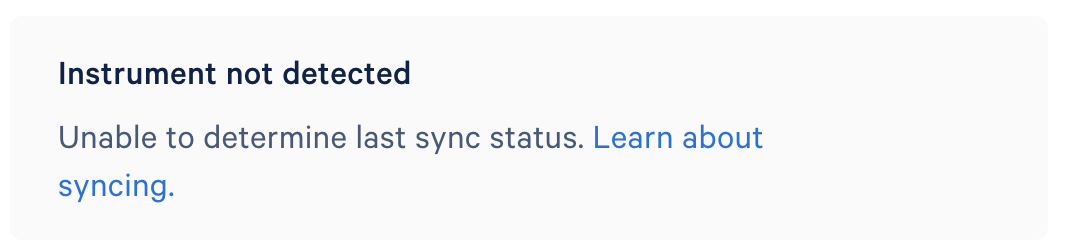
Instruments that are powered off or offline will show "Instrument not detected" status:
Please contact support@10xgenomics.com for help registering an instrument.
† Connected instruments are those that are powered on and meet the connectivity requirements detailed in Xenium Analyzer: Network Connectivity Guidelines (CG000645).