- Automatically corrects Visium HD CytAssist images generated with instrument firmware v2.1 when uploaded for manual alignment. This allows Loupe to generate alignment files with corrected fiducial coordinates relative to the tissue.
- Fixed a bug displaying and using incorrect projection in secondary reclustering.
- Fixed a bug showing incorrect barcode count when assigning a selection to a group and cluster.
- Updated the label "All significant genes per selected cluster" to "All detected genes per selected cluster" in the Feature Table settings to better reflect that this option does not filter by statistical significance.
- Updated the export option label from "All Gene Expression" to "All Available Genes" in the Feature Table to clarify that the export will include all genes currently displayed in the view.
- Fixed a bug where the lasso and rectangular selection tools became unusable after importing V(D)J clonotypes from a
.cloupefile. - Improved the user interface to wrap long cluster names across multiple lines, improving readability for long feature names such as granular cell types from Cell Annotation.
- Fixed bug introduced in Loupe Browser v8.0 that prevented the cluster name legend on UMAP and t-SNE from being included on
.pngand.svgexports. - Fixed a bug that prevented Differential Expression analysis from running on large datasets containing more than 1 million cells.
- The "Combine all Features" option on the Feature screen has been disabled for datasets with more than 100 million barcoded features (features × cell barcodes) to facilitate smoother exploration of large datasets.
LoupeR updates
- LoupeR v1.1.2 is now available!
- This version has improved barcode format validation and better error messaging for a smoother user experience.
- Fixed a bug where LoupeR users were unable to re-import custom barcode groups from
.csvfiles into Loupe Browser after generating.cloupefiles with Seurat-formatted barcodes.
- Fixed a bug where LoupeR users were unable to re-import custom barcode groups from
- Added a new feature that enables the conversion of Visium HD and Xenium datasets with updated scripts. Please note that while this feature is enabled, it is unsupported for these barcodes, and only expression data (not images) will be included in the resulting Loupe file. More details can be found here.
- Enter the era of whole transcriptome analysis at high definition: Loupe Browser v8.0 supports visualization and analysis of Visium HD!
- Loupe Browser v8.0 visualizes Visium HD bins, and seamlessly enables exploration of transcript data and microscopy images.
- New tutorial: Mapping the Tumor Microenvironment with Visium HD.
- Manual aligner for Visium HD includes auto detection of slide ID, automated fiducial refinement, and an optional tissue selection step.
- Explore the relationships between cell types or pathways with the new co-expression functionality.
- Select two feature lists to visualize co-expression of two genes or lists of genes for most Chromium and Visium experiments. Not compatible with ATAC and Multiome datasets.
- Analyzing a large dataset? No problem. Loupe Browser v8.0 enables differential expression and reclustering analysis for unlimited barcodes.
- Differential expression and reanalyze now have a progress bar and estimate analysis time, as well as a cancellation button.
- A new version of LoupeR (v1.1) is available which enables conversion of GEM-X data (Chromium Single Cell) in R to a
.cloupefile. Not applicable to Visium. - General bug fixes and improvements.
- Bug fix to enable differential expression and reanalyze features for macOS Catalina and Big Sur
- Bug fix to enable Peak View in Multiome datasets
- General user interface improvements
- It’s a whole new Loupe Browser! New user interface enables faster data analysis through easy feature discovery and in-app descriptions of analysis options.
- Analyze Seurat processed data without coding. Use the LoupeR package to convert your Seurat object to a CLOUPE file. LoupeR files must be opened with Loupe v7.0 or later.
- Find genes of interest across experimental conditions using the new Multi-sample Differential Expression feature! Taking a pseudobulk differential expression approach with a user-friendly interface, Loupe Browser 7.0 allows users to find cell-type specific genes of interest in case vs control experiments.
- Visualize and analyze Visium Protein Expression! Antibody list automatically populated under the Active Feature List tab, and updated user interface enables easy barcode selection.
- Perform cell typing analysis of Reference Free Deconvolution results through the new Spot Deconvolution feature!
- Files must be generated using Space Ranger v2.1 or later.
- Export Heatmap as high-resolution SVG files.
- Bug fixes and general improvements, including deleting reclustering results and changing spot opacity in the Visium manual aligner.
- Bug fix to address loading of BigTIFF images in Visium manual aligner and general improvements.
-
Improved interactivity with V(D)J and Barcode Enabled Antigen Mapping (BEAM) datasets, including:
- New and improved user interface for assigning categories to clonotypes.
- Pre-populated BEAM antigen list in the Active Feature List drop-down menu.
- Ability to filter BEAM datasets by antigen specificity score.
-
Bug fixes and general improvements.
-
Projections can be exported as vector SVG files, providing a higher resolution image to use for presentations and publications. SVG files can be directly edited to modify the color scheme, text and location of different components using any vector graphics software.
-
A new filtering and reclustering feature is enabled for Visium datasets. Perform quality control on your experiments, or reanalyze your data to focus on specific tissue regions to deepen your understanding of your Visium dataset.
- Spatial Reclustering tutorial
- The reclustering workflow is intended to work on individual samples processed with
spaceranger countand does not work for samples combined usingsapceranger aggr
-
Bug fixes and general improvements
-
Loupe Browser 6.2 introduces support for CytAssist! CytAssist and microscope images can now be aligned using the CytAssist Image Alignment under Visium manual alignment.
-
New functionalities to improve Visium Fiducial aligner experience, including:
- Introduction of QPTIFF support
- Enabled naming of immunofluorescence channels, which are displayed in Space Ranger output files and Loupe analysis mode
-
Reclustering for Gene Expression (GEX) data in GEX + Antibody Capture, GEX + CRISPR Guide Capture, and GEX + ATAC datasets is now available.
-
New diverging color scales available for visualizing gene/feature expression.
-
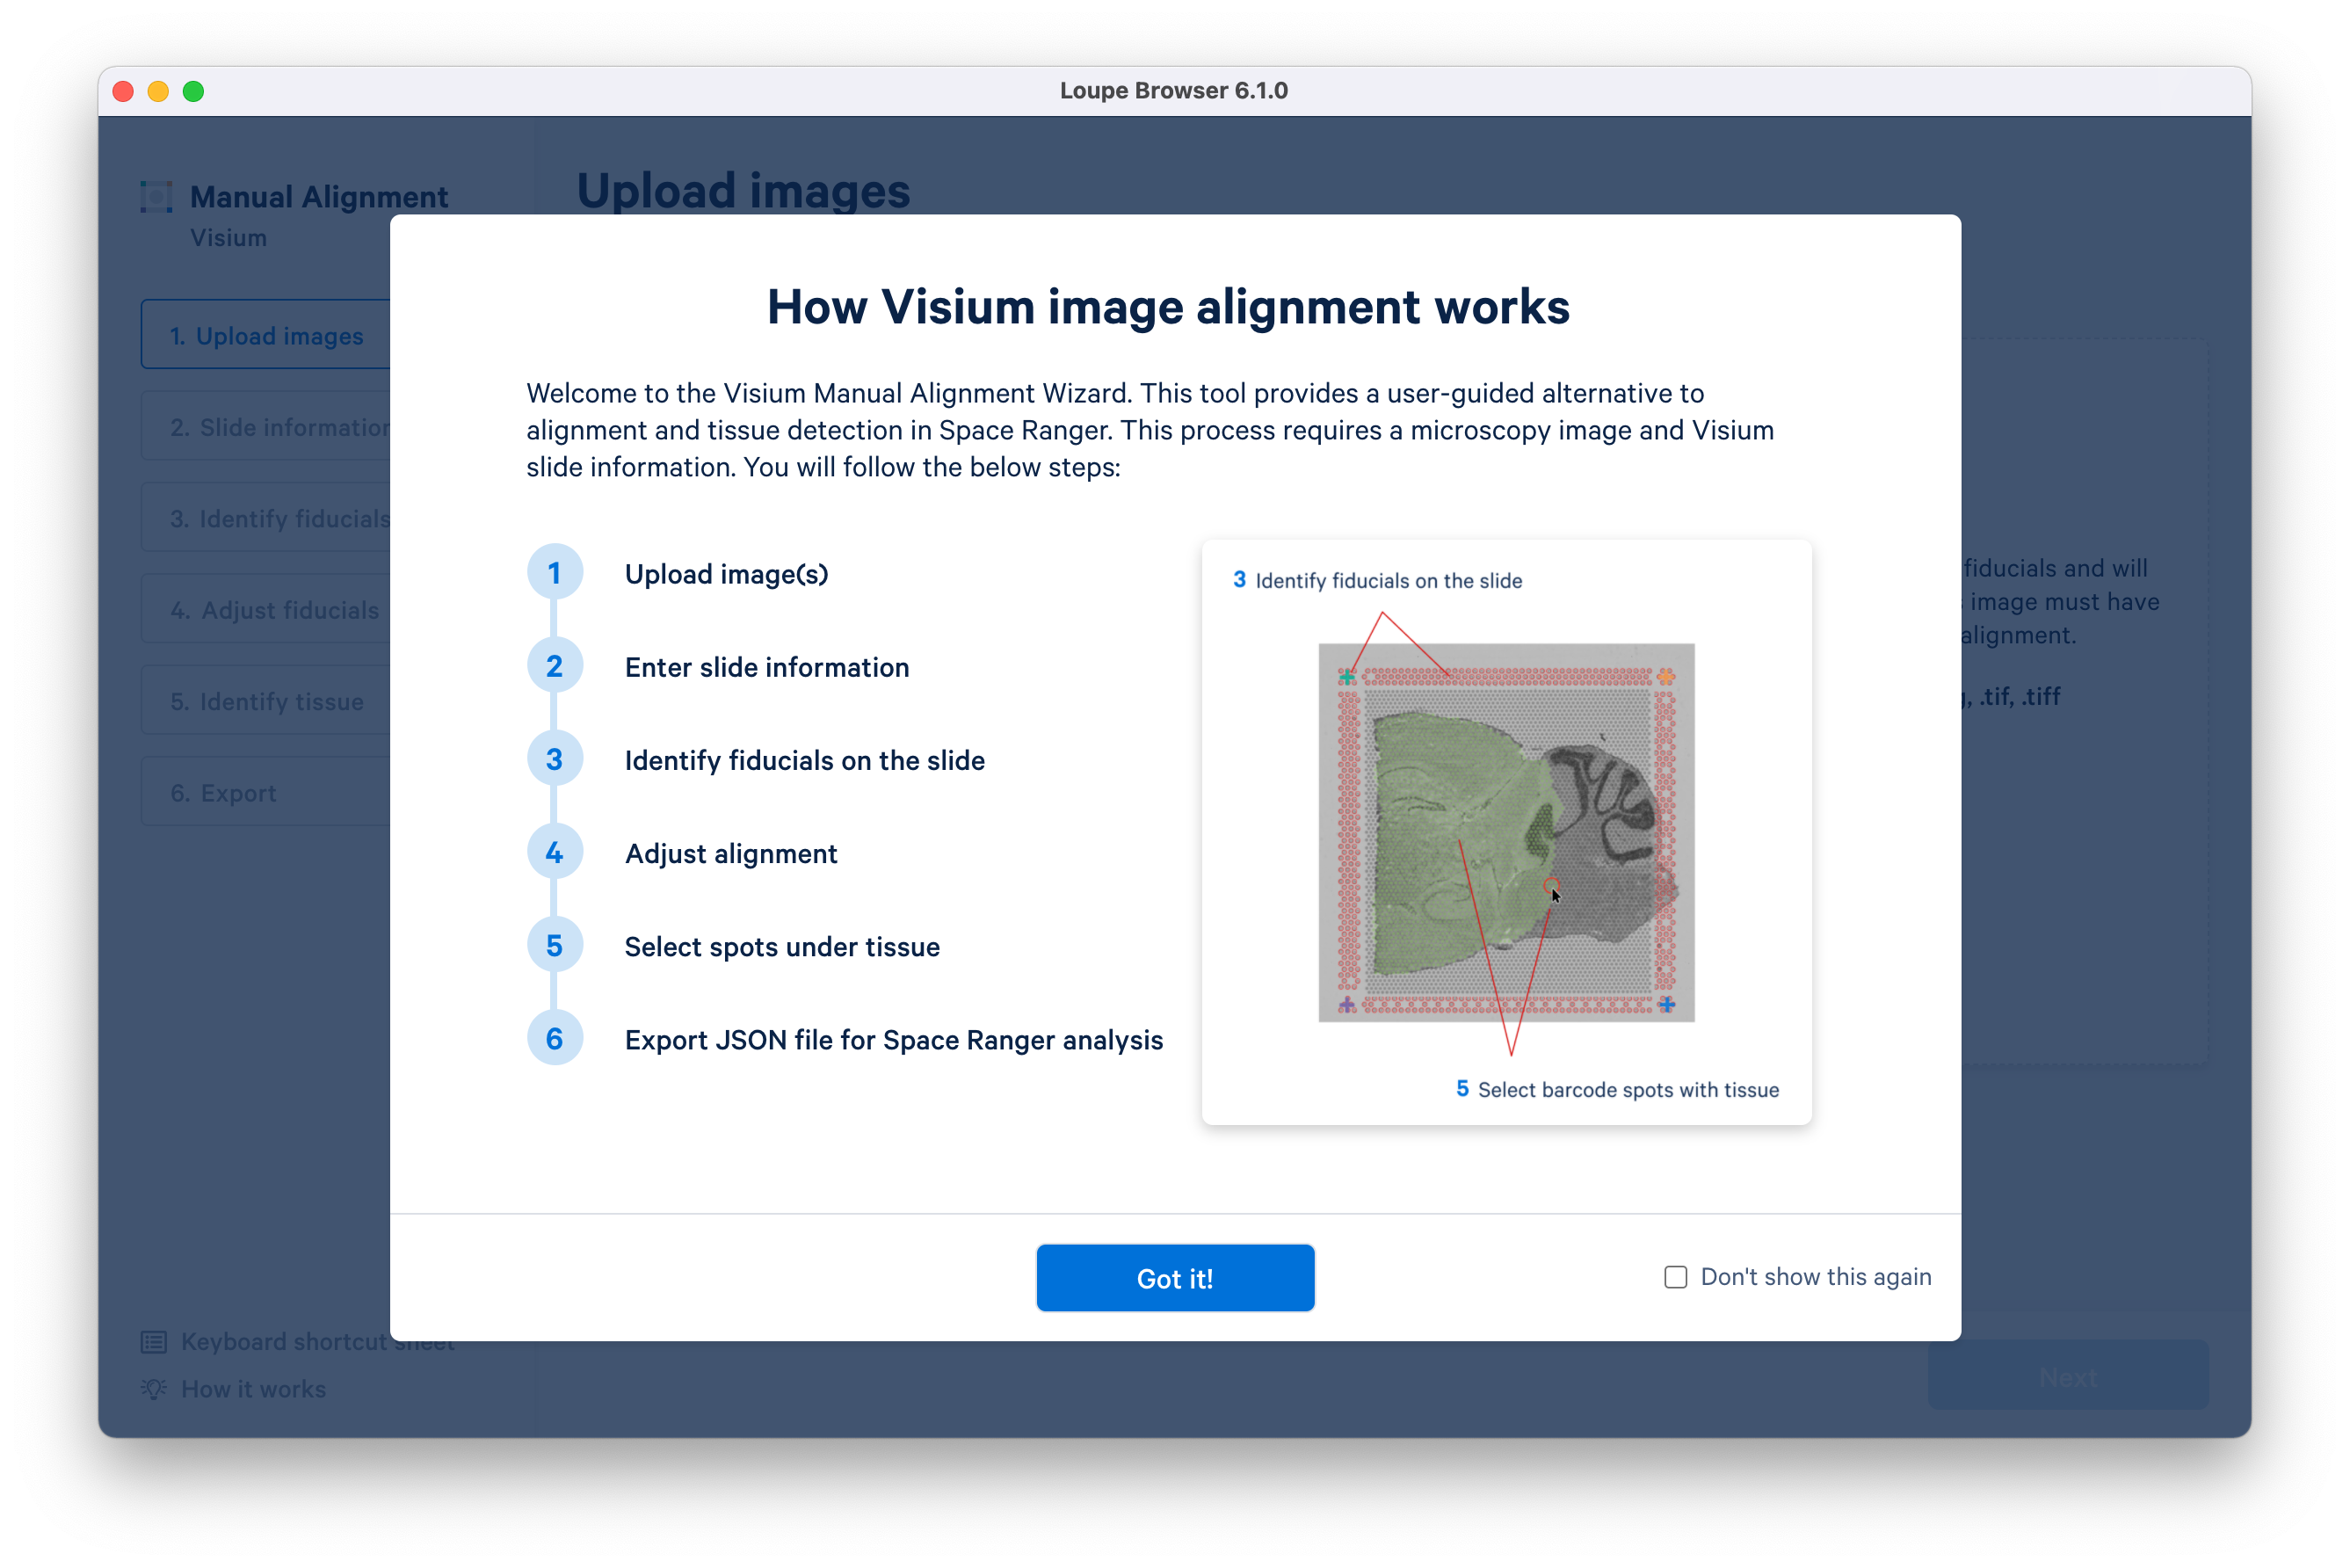
Loupe Browser 6.1 introduces a redesigned Visium manual aligner to enable faster and more accurate manual alignment of Visium data before exporting into a Space Ranger run. This update includes:
- Support for manual alignment using three corner fiducials (instead of four) for images where one of the corner fiducials may be obstructed
- Introduction of keyboard shortcuts for common manual aligner actions
- Introduction of an auto-leveling toggle for image brightness and contrast to better visualize the microscope image in one click
- Support for image zooming, allowing higher precision throughout the wizard
- Introduction of shortcuts to quickly select and deselect all spots at the tissue selection step
- The embedded Spatial Tutorial dataset now allows the exploration of the spatial enrichment (Moran’s I) feature.
- For Feature Barcode datasets, the lists of antibodies, CRISPR guides, Cell Multiplexing oligos, or custom features used in the experiment are now included in Loupe Browser as an option under the Active Feature List.
- Loupe Browser 6.1 now requests to collect anonymous, non-biological usage data, from users who opt-in, to help improve Loupe Browser.
- Bug fixes and general improvements
Loupe Browser 6.0 includes several major performance improvements to enable rapid data exploration of high throughput and multi-sample experiments across all data types.
- The Loupe rendering methods have been reworked under the hood to enable faster than ever visualization, interaction, and analysis of Loupe datasets of 1 million+ cells. You may notice minor updates to visualization and selection functionality as a result of this update.
- Differential expression has a major performance improvement with 4x faster calculation speeds and support for up to 1 million cell datasets.
- The export of projection coordinates as a CSV is now supported, including for newly generated tSNE and UMAP projections via the Filtering and Reclustering Wizard for Single Cell Gene Expression datasets.
- Bug fixes and general improvements.
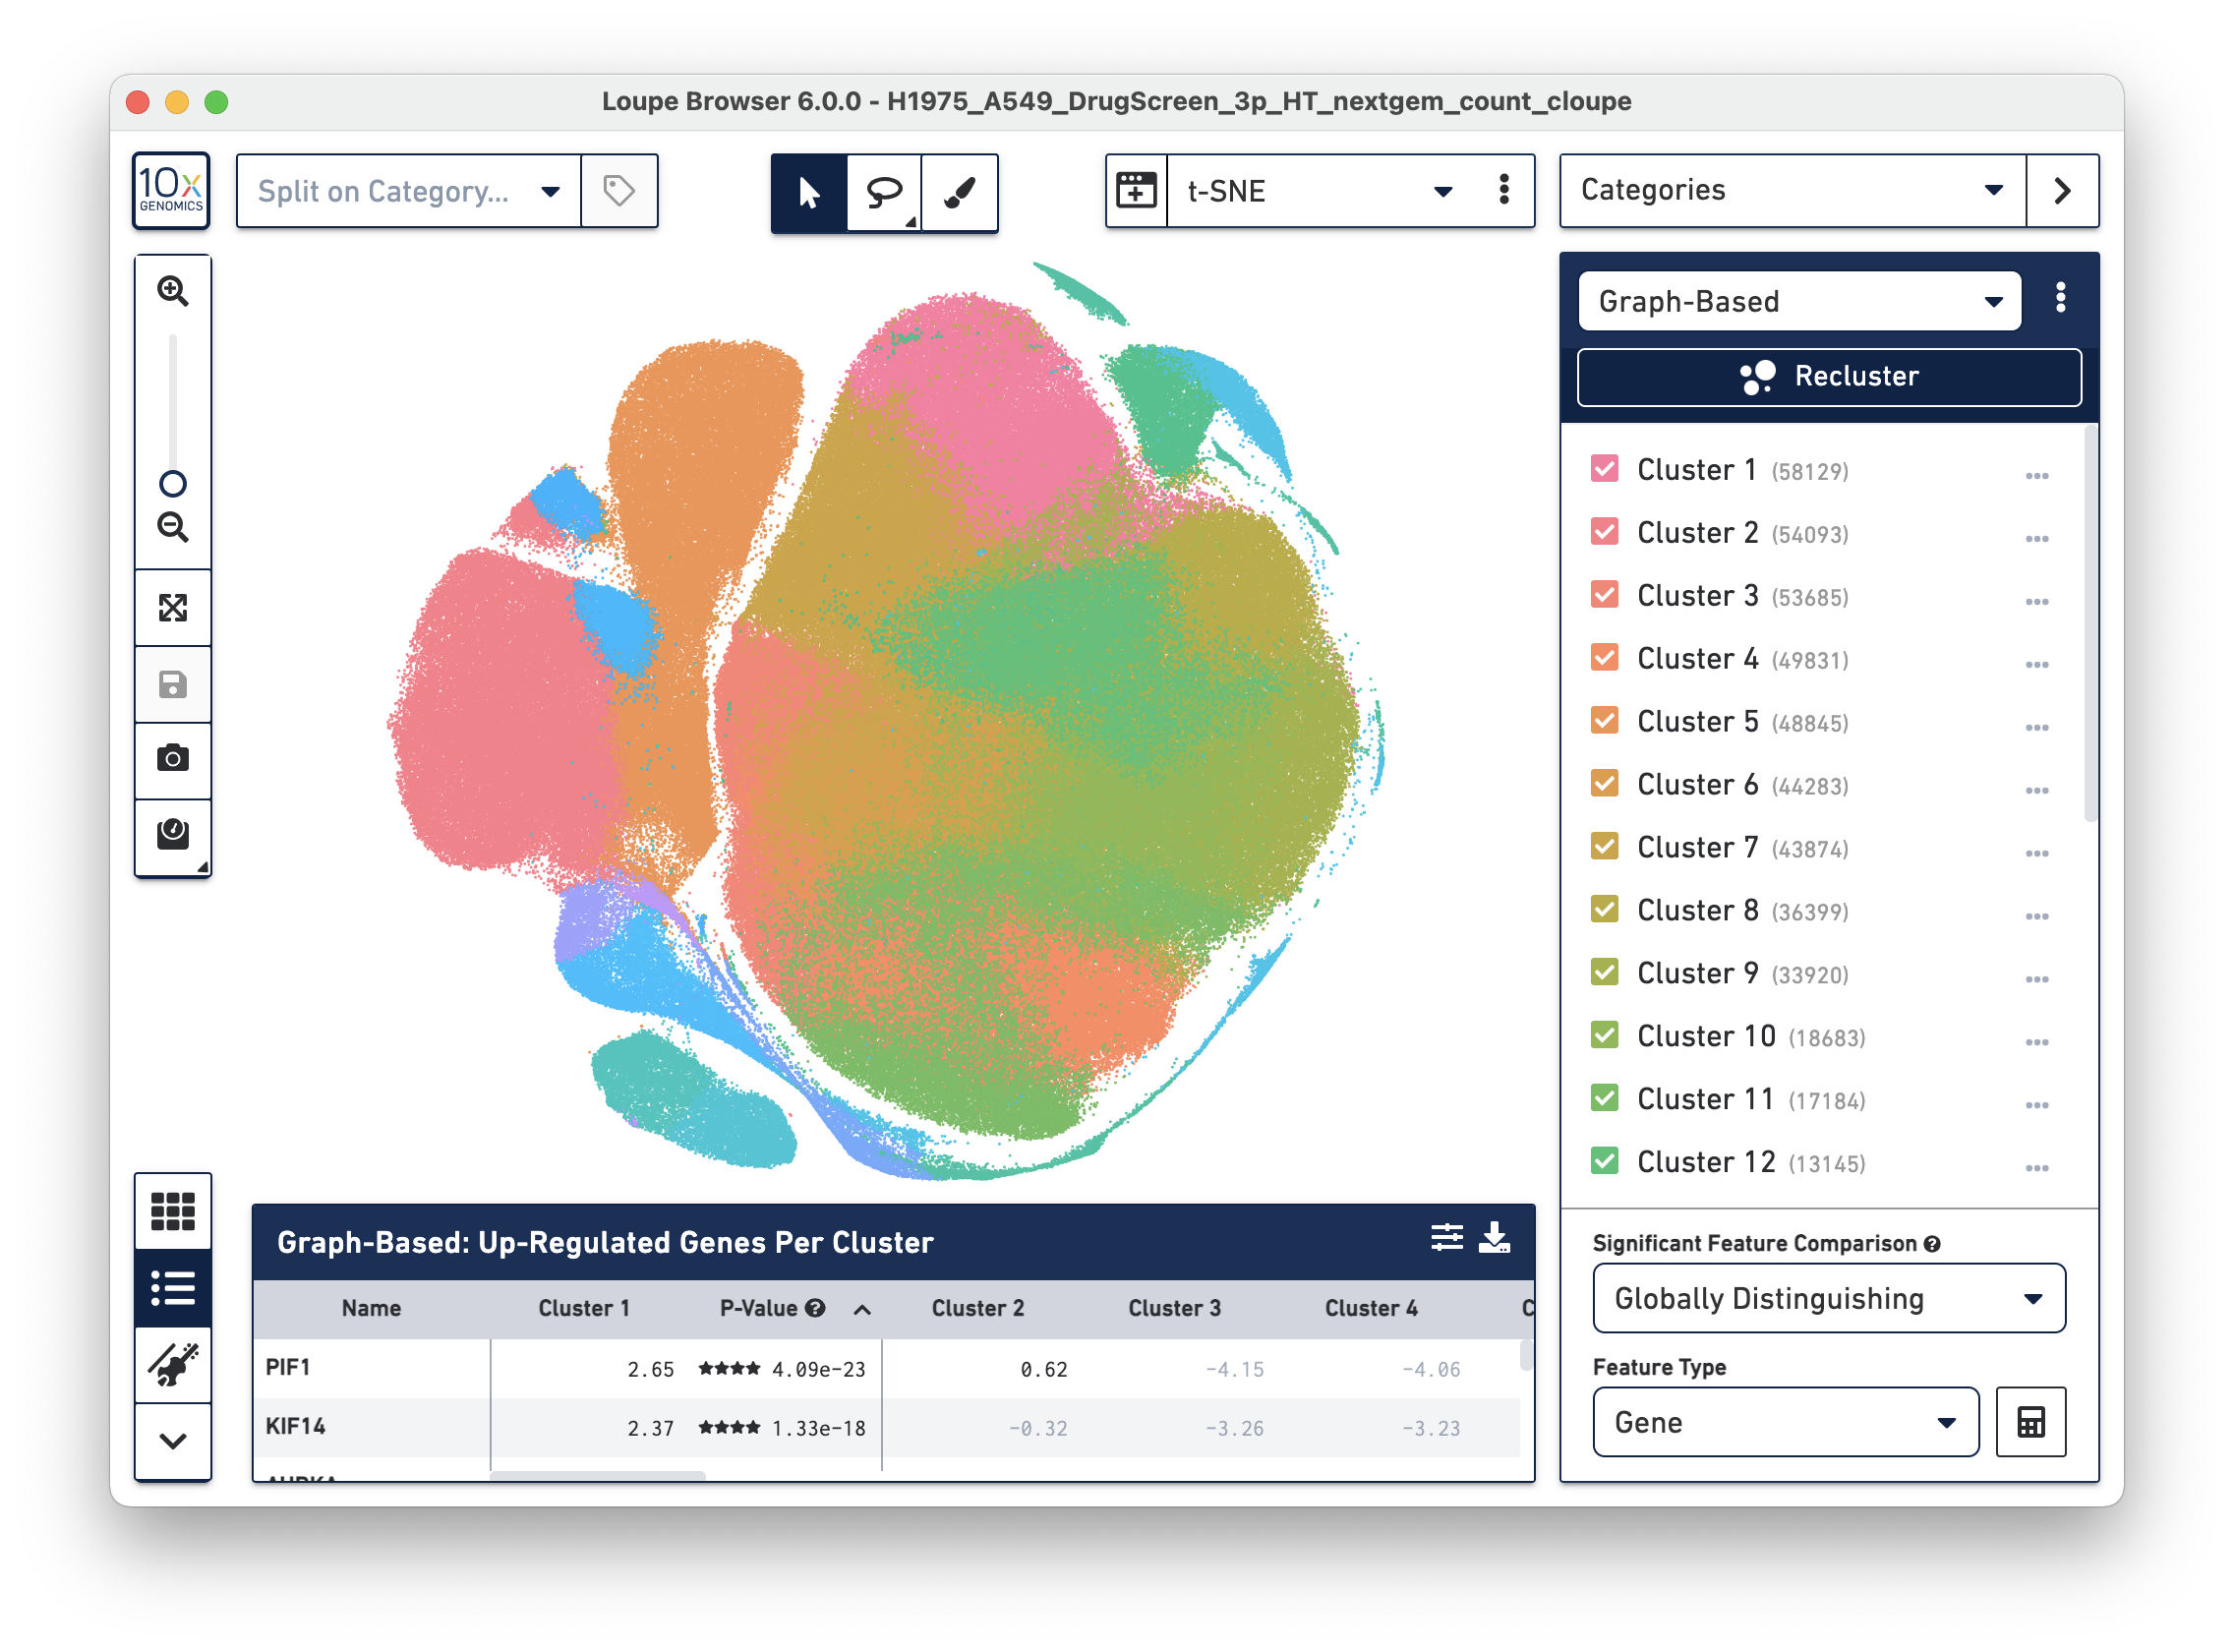
- Visualized above is a 3' HT CellPlex 525k cell sample dataset - download and explore it here.
Loupe Browser 5.1 includes several new features to support core workflows, including updates to the filtering and reclustering feature for Single Cell Gene Expression and improvements to the Visium manual alignment wizard for Spatial Gene Expression.
Single Cell Gene Expression
- The Filtering and Reclustering workflow now has the option to generate a UMAP projection in addition to the t-SNE projection.
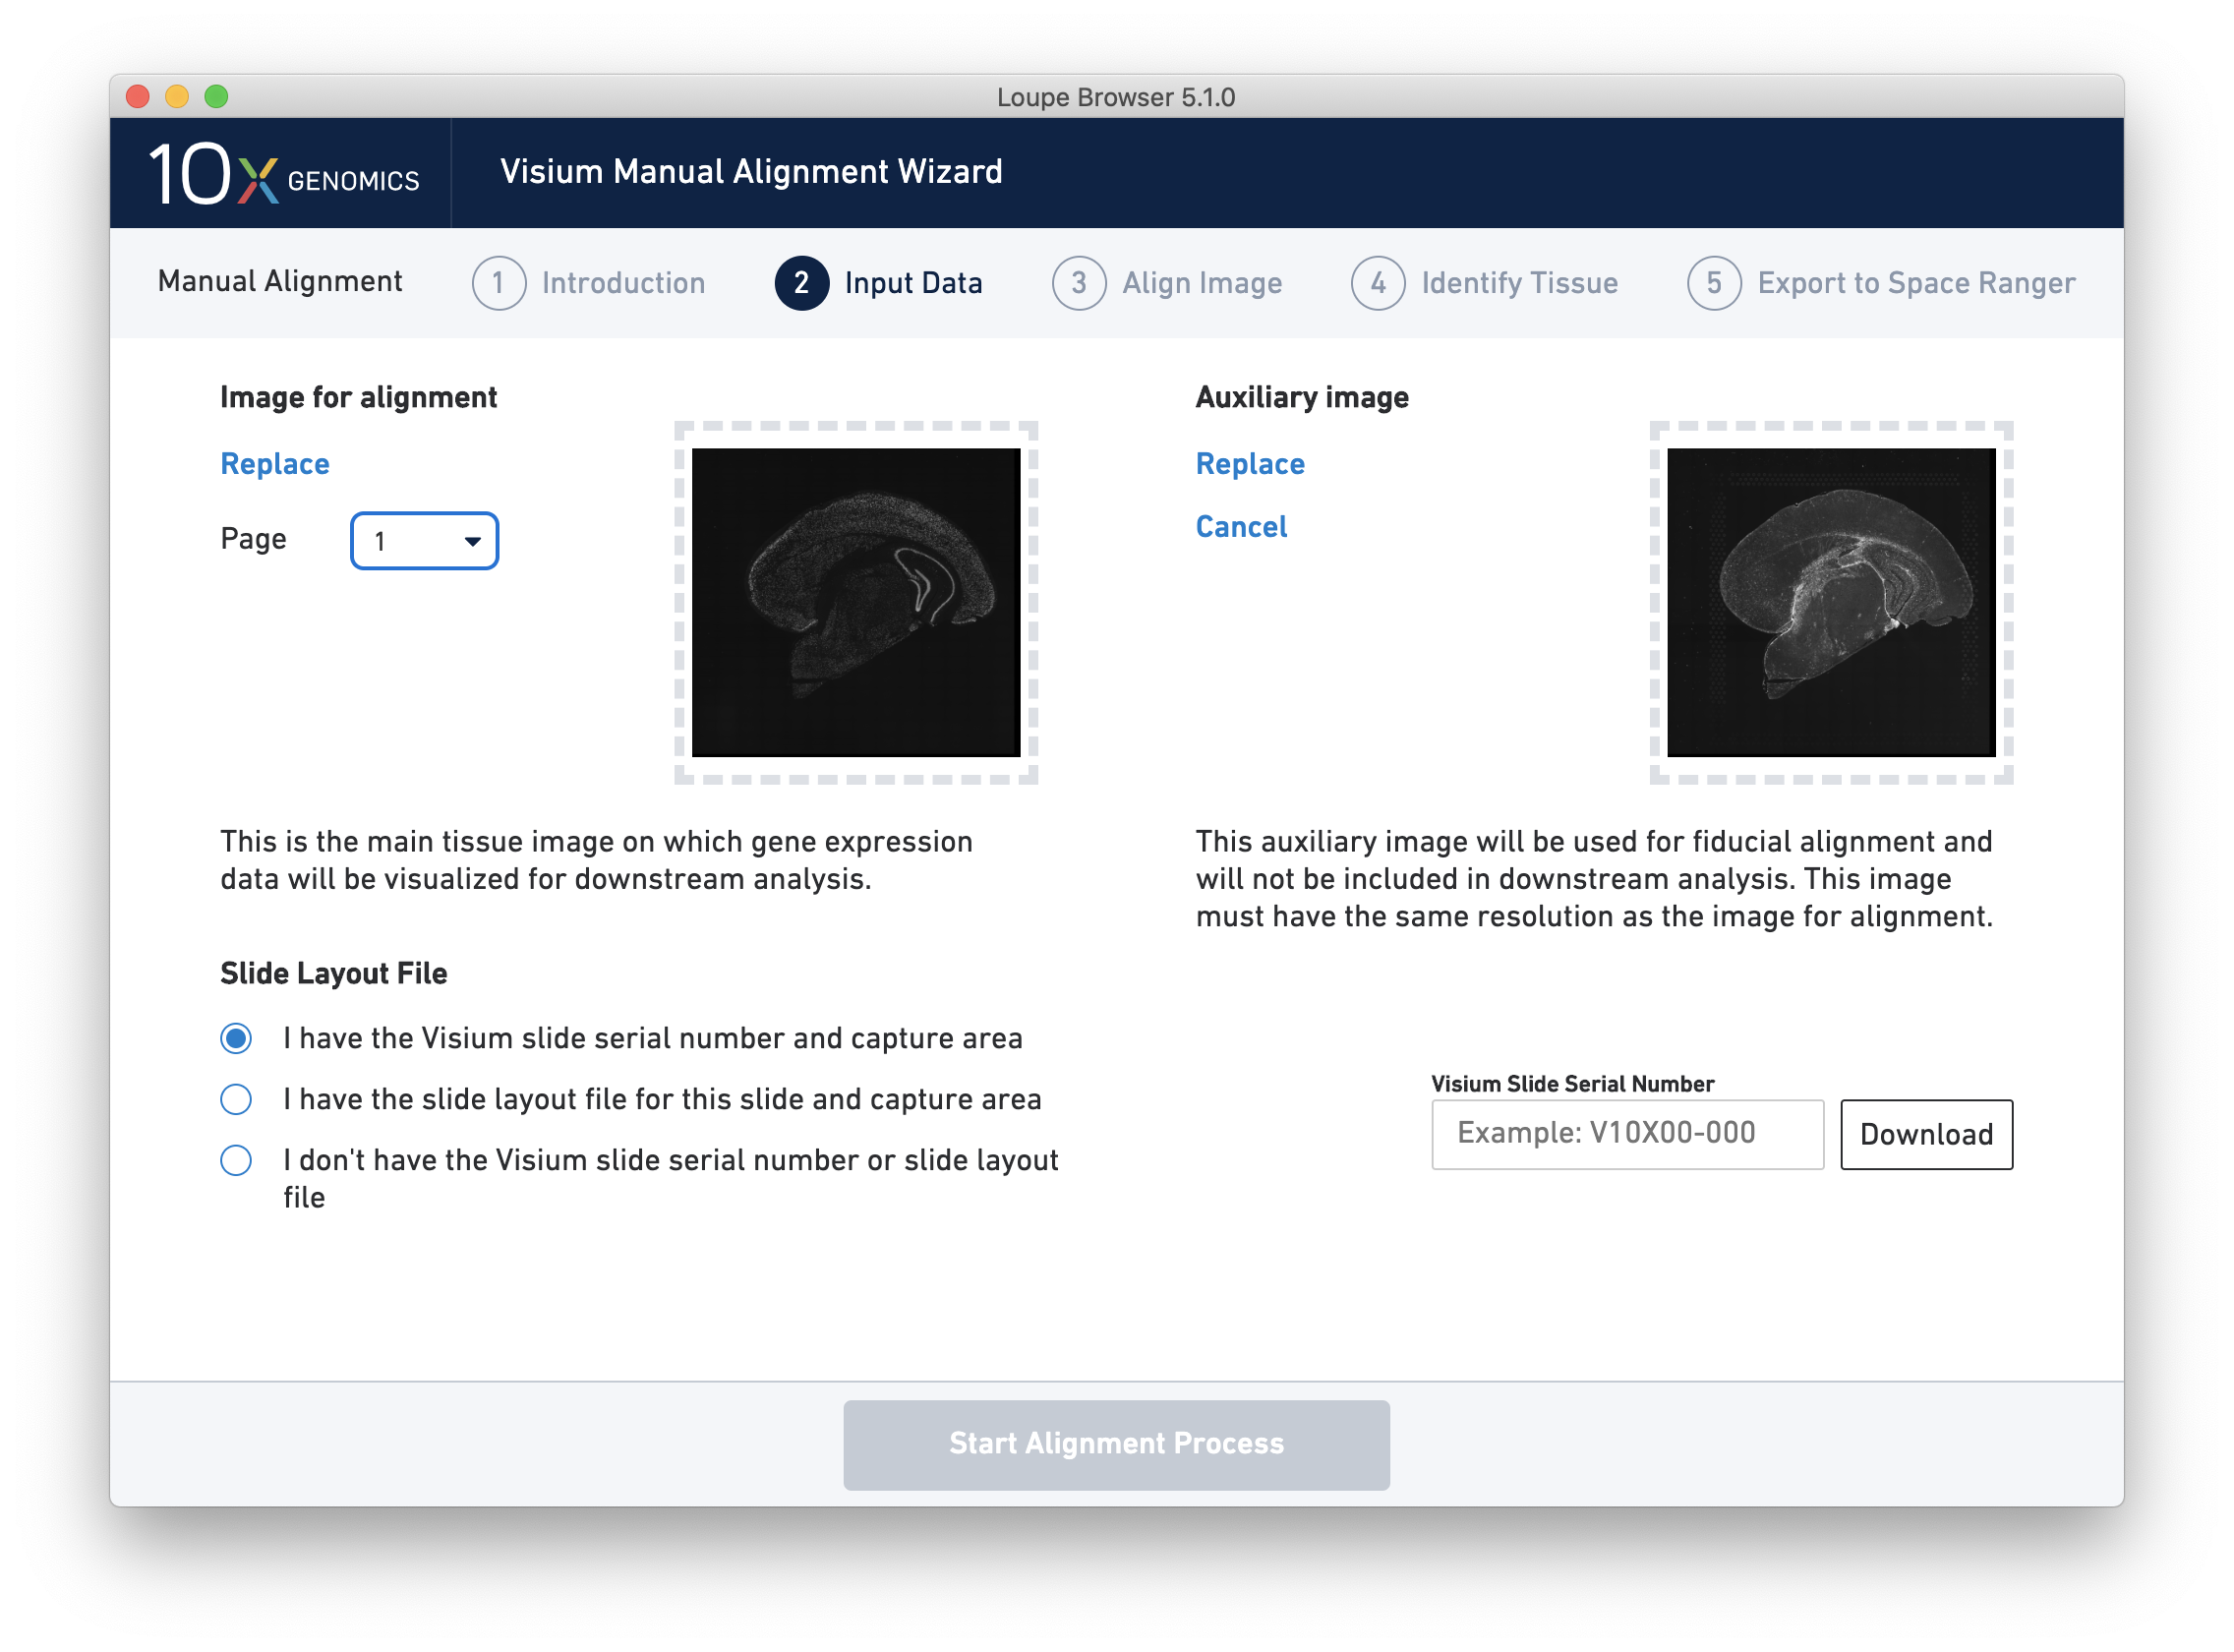
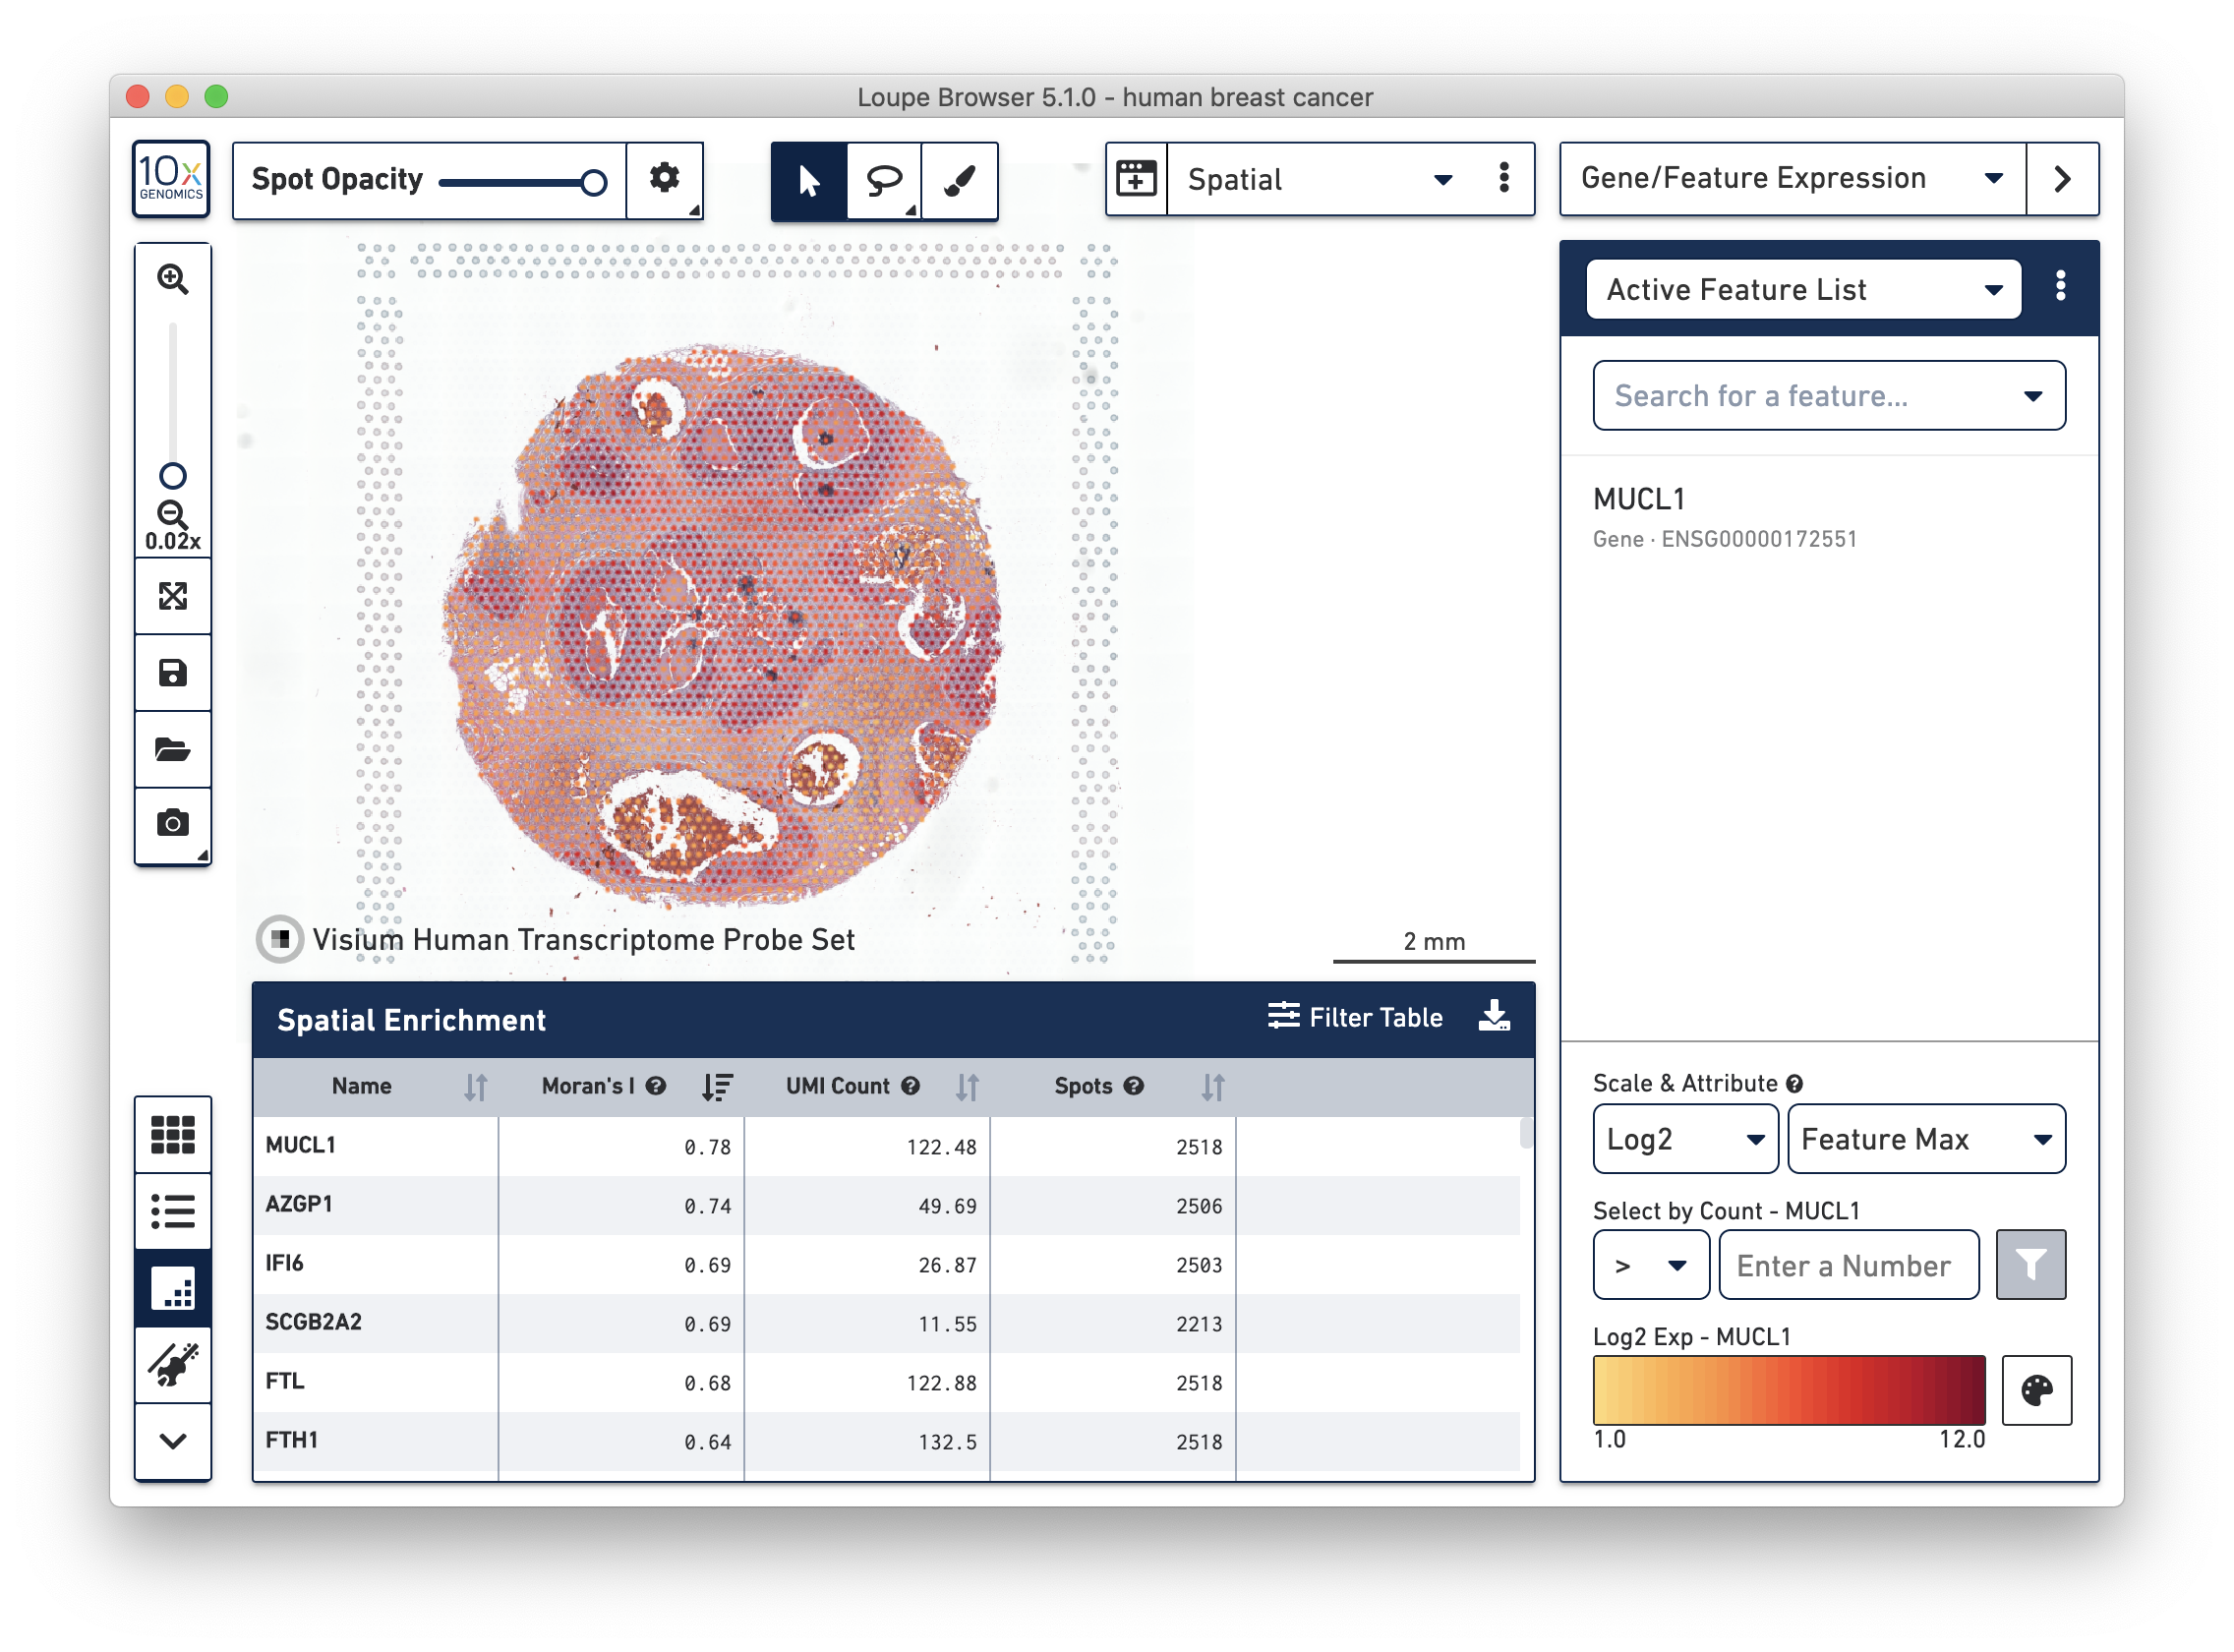
Spatial Gene Expression
- Homepage layout has been updated to make the Visium Image Alignment wizard more visible in the main window.
- Visium Image Manual Aligner now includes additional support for images with difficult to detect fiducials. This release introduces the option to load a separate overexposed image to be used for fiducial selection, or an additional overexposed channel in the same image file, which can be used for fiducial selection and excluded from downstream analysis in Space Ranger and Loupe.
- A new Spatial Enrichment table which allows users to sort and filter features by their Moran’s I value for Visium Spatial Gene Expression datasets run on Space Ranger 1.3 and later.
Improvements For All Applications
The following improvements have been made to Loupe Browser 5.1 that impact all applications:
- Updated homepage with a new option to complete a survey to share feedback and feature requests directly with 10x Genomics.
- Interaction improvements for the differential expression table.
- Bug fixes and general improvements.
- Adds support for pyramid TIFFs, or TIFFs with multiple pages of the same image at different resolutions, in the Visium manual aligner.
- Updates differential expression and violin plots to reflect currently visible data.
- More clearly indicates when differential expression has not yet been calculated for an active category or set of clusters.
- Fixes bug where differential expression fails when viewing data points not in the currently visible projection.
- Fixes bug where reclustering calculation never completes on certain Windows machines.
- Fixes bug when switching between feature plot and other projections.
- Fixes crash when deleting an imported projection in a multiome ATAC + gene expression dataset.
- Adds error message when an imported projection name duplicates an existing projection name (such as "tsne").
- Changes default export name for differential expression table.
- Updates the certificate on the Windows installer.
Filter and Recluster
Loupe Browser 5.0 has been updated to allow users to filter and recluster single-cell gene expression datasets. With Loupe's new intuitive, high-performance filtering and reclustering workflow, users can filter out low-quality cell barcodes, narrow on cell types of interest for a more focused study, and explore and share the results of their reanalysis, all interactively, without writing a single line of code.
The reclustering workflow allows for inclusion or exclusion of barcodes by:
- Precomputed or custom cluster membership
- UMI count
- Distinct feature count
- Mitochondrial UMI Fraction
- CSV upload list
The reclustering algorithm generates a new Louvain-based clustering and a t-SNE plot over the filtered dataset. Datasets with less than 10,000 cells should be processed in under two minutes, and Loupe supports reclustering operations on datasets as large as 100,000 cells.
For more information and a guide to the workflow, visit the filtering and reclustering page.
Integrated Gene Expression + V(D)J Clonotype Analysis Updates
Loupe Browser 5.0 includes updates to the clonotype table, with new filtering options and improved performance with high cell count .vloupe files.
Support for Cell Ranger 5.0 VDJ Datasets
Loupe Browser 5.0 now only supports the loading of VDJ clonotypes created with Cell Ranger 5.0 and later. Previous versions of Loupe Browser may be used to look at VDJ data generated by Cell Ranger 4.0 and earlier.
New Clonotype Table Filtering Options
Identify potential invariant natural killer T (iNKT) cells and mucosal-associated invariant T (MAIT) cells with a new clonotype table filter. The iNKT/MAIT evidence filter can be used to view clonotypes that contain any cells with supporting evidence in any of the TRA genes, TRA junctions, TRB genes, or TRB junctions of being an iNKT or MAIT cell. This filter is only visible for T cell datasets.
There are other powerful filtering options added in this release:
- The clonotype table can now be filtered by sample for
.vloupefiles generated byaggr. - Clonotypes in B cell datasets can be filtered by light or heavy chain isotype.
Concurrent Installation with Previous Releases
Loupe Browser 5.0 can be installed concurrently with a currently installed version of Loupe Browser 4.0 or lower. This is required to be able to support visualization of VDJ data created by Cell Ranger 4.0 or earlier.
Differential Expression
Differential expression is now more intuitively tied to the active category. If a differential expression calculation has not been run for the currently selected category, the differential expression table and heatmap will appear blank and prompt you to run the calcuation, instead of showing the most recently calculated differential expression.
Loupe Browser 4.2 is primarily a release in support of the Single Cell Multiome ATAC + Gene Expression assay, as well as the Cell Ranger ARC 1.0 pipeline.
For more information about Multiome updates, click here, or start the Loupe multiome tutorial.
Split View
The Split View menu has been streamlined, with the ability to quickly select any clustering to split by, and easy toggling of cluster labels.
For single-cell applications, Loupe Browser 4.1 offers new ways of concurrently looking at multiple data views, as well as violin plots, log-normalized expression profiles, and general user interface improvements. It is compatible with .cloupe files generated by all versions of Cell Ranger after v1.3.
Linked Windows
Loupe Browser 4.1 introduces the concept of linked windows, windows that provide concurrent views of the same dataset.
For example, with datasets generated with Cell Ranger 3.0 and Space Ranger, it is possible to view t-SNE, UMAP, spatial, custom projections, and feature barcode-derived projections concurrently. Operations in one window, such as switching categories or displaying the expression of a particular gene, propagate to the other windows. Pan and zoom remain independent between windows.
A linked window can be opened by clicking on the window icon on the left side of the view selector. This brings up a list of available projections. Selecting a projection launchs a window in mini-mode, with a subset of interface options available. A mini-mode window can be expanded by clicking on the expand icon at upper-left, which replaces the 10x icon. Multiple full windows for the same dataset make concurrent display of a variety of information much easier.
Split View
In t-SNE and UMAP views, the Split View selector has moved from the toolbar to the upper left of the window. This allows more rapid organization of these projections by cluster.
Selector Tool
The rectangular and polygonal selection tools at the top of the window have been combined into a single button, which is toggleable. A draw selection tool has been added to the right of the selection buttons, which allows for more precise selection of cells or spots, particularly in spatial views.
Log Normalization
It is now possible in Loupe Browser 4.1 to view feature expression normalized by UMI count (for single-cell and spatial datasets) or cut site count (for ATAC datasets). This is activated by selecting LogNorm as the scale in Feature Expression view, instead of Log2 (the default).
The log-normalization method is the same as methods used in Seurat and scanpy, with quantitative expression computed as follows:
LogNorm(feature, barcode) = ln(10000 (feature count/barcode count) + 1)*
where the barcode count is the total number of UMIs or cut sites associated with the barcode. The relative expression ratio is multiplied by 10000 in order to shift the relative expression distribution above the constant introduced by the log1p operation.
Violin Plots
Log-normalization is important when viewing comparative expression across clusters, which is now viewable via Violin Plots. Violin plots can be opened by pressing the violin plot icon in the Data Panel selector.
Violin plots show expression distributions of the currently active feature (or list of features), for the active category. Changes to either the active feature list or selected category are reflected in the Violin Plot. Hovering over each violin graph shows aggregate statistics of feature expression for that graph's cluster.
Violin plots are exportable to SVG or PNG formats. To save a Violin Plot, click on the Export icon and select Export Plot as PNG or Export Plot as SVG.
Loupe Browser 4.0 has been updated to allow users to easily analyze data generated with the Visium Spatial Gene Expression Solution, while still allowing users to easily explore single-cell gene expression, immunology, and ATAC data. It is compatible with all versions of Cell Ranger after v1.3, though the focus of the release is on support for spatial gene expression files generated by Space Ranger 1.0.
Added Expression Color Palettes
Enjoy a variety of new color palettes for feature expression, including inverted color scales, Turbo, Viridis and Plasma. The heatmap color scheme should also make it easier to see differences in differential gene patterns between clusters.
Lifted Limits
Loupe Browser will warn, but not prevent you from doing the following:
- Differential expression on datasets over 100,000 cells
- SVG export on datasets over 100,000 cells
Bug fixes
- Better behavior in split view.
- Do not grey out ATAC motif expression levels outside the default range.
- Notarized for warning-free distribution on macOS Mojave and Catalina.
General Improvements
- Fixes Split View bugs when importing custom projections.
- Fixes default name of screenshot export.
- Correctly update filter UI elements after switching between filters.
Gene Expression Improvements
- Support antibody-only datasets.
- Render UMAP projections computed by the Cell Ranger 3.1 pipeline.
- Bugfix: fix UMI Count overcount on datasets generated with Cell Ranger 3.0.
- Share heatmap filtering options with the data table.
- Add ability to drive the differential expression heatmap with a feature list.
- Correctly size the differential expression heatmap when the bottom panel is resized.
- Fix case where selecting Total UMI Count for multi-species datasets could trigger a crash.
ATAC Improvements
- Speeds up display of motif z-scores.
- Fixes case where fragments file may be incorrectly reported as not pertaining to a dataset.
- Avoids hanging when opening a file saved with a feature list containing both a motif and nearby gene.
Filtering
Filter for cell types by creating complex boolean filters. For example, to filter for mature B Cells, you could create the statement (CD79A OR CD79B) AND TCL1A = 0. Please refer to this tutorial for further guidance on how to use this feature.
Projection Import
Import data from your favorite projection methods using a simple CSV format. For more details on the file format, please check the projections section of the interoperability documentation.
Multi-Windows
You can now have multiple windows open simultaneously. This will allow you to compare aspects of the same dataset side by side or keep concurrent analyses open at one time. To create new windows, you can click on File > New Window within Loupe Cell Browser or double click on a cloupe file.
Feature Expression Coloring
We have provided a variety of alternate colormaps from which to choose. You can also manually adjust the endpoints of the colorscale. View the Loupe Browser Navigation for Single Cell tutorial for more details.
Projection Settings
Exports of the barcode plot will now include the relevant legend (categories or gene/feature expression). Barcode plot point size will now scale with zoom level. There is also an option to manually increase or decrease the marker size.
Updates and Bug fixes
- "Active Feature List" now saves to the cloupe file
- Feature Plot exports with axes labels
- See the full cluster name while hovering in both the categories panel and in the barcode plot
- Get email address to submit feedback in the help menu
- Default filenames for barcode plot exports includes sample id
- Improved feature list search performance
- Fixes bug where 2-D projection dots could temporarily disappear in datasets with high numbers of cells.
- Fixes bug where rectangular and lasso selection tools would not correctly select points in t-SNE plots when one of the axes in Feature Plot is set to log scale.
- Fixes bug where a user could not filter the V(D)J clonotype list by multiple concurrent genes.
Loupe Cell Browser 3.0 has been updated to allow users to easily analyze data generated with the upcoming Feature Barcoding technology for Gene Expression and Immune Profiling applications, as well as from the new Chromium™ Single Cell ATAC solution.
To find out how to use Loupe Cell Browser 3.0 to analyze single-cell chromatin accessibility data from Cell Ranger ATAC, please consult the Loupe Cell Browser ATAC documentation.
Compatibility with Cell Ranger and Previous Loupe Versions
Loupe Cell Browser 3.0 can view .cloupe files generated by Cell Ranger 1.3 and later, and is required for viewing .cloupe files generated by Cell Ranger 3.0 and later. Files saved within Loupe Cell Browser version 3.0.0 and later will not be readable by versions 1.0.x or 2.0.x of Loupe Cell Browser.
Feature Barcoding Support
Loupe Cell Browser 3.0 includes support for Feature Barcoding applications. It can display counts generated by Cell Ranger 3.0 from all Feature Barcoding analytes, such as cell surface markers, peptide-MHC multimer binding, and CRISPR guide RNAs. Loupe Cell Browser also makes it possible to view t-SNE plots derived from feature barcodes, identify the most enriched feature barcoded analytes from a cluster of cells, or even determine the most preferentially bound antigens from cells with the same clonotype.
Multi-Species Support
Cell Ranger 3.0 now generates a .cloupe file for multi-species experiments run with a joint reference. Loupe Cell Browser will compute an aggregate transcriptome expression count per cell, to allow for easy segmentation by species, or joint analysis for host-virus applications.
Aggregate Feature Sums
Starting with Cell Ranger 3.0, .cloupe files include aggregate feature sums, such as the total number of cell surface markers detected per cell, total number of guide RNAs per cell, and total number of counts associated with a custom condition in a Feature Barcoding reference file. Typing "Sum" into any of the feature autocomplete boxes should show the full range of sums available. Sums are not available for .cloupe files generated with Cell Ranger 2.2 and earlier.
Feature Plot View
The new Feature Plot, available via the new projection selector at the top of the window, makes it possible to graph barcodes by one or two features at a time.
Individual features and aggregated feature sums as computed by the Cell Ranger 3.0 and Cell Ranger ATAC pipelines may be plotted in the Feature Plot. The Feature Plot makes it easier to identify cells with high relative expression, to define thresholds for one or two features, and to isolate positive cell populations against negative controls. Both linear and log scales are supported, and it is possible to can color cells in the Feature Plot in the same manner as the t-SNE plots.
Export Projections to SVG
Clicking on the camera icon in the toolbar now shows a menu with actions to export to either PNG or SVG format. Export to SVG format to save the active plot (including axes) for inclusion in papers or higher-resolution contexts. Export to SVG functionality is limited to datasets with 100,000 cell barcodes or lower.
Split View
Split View is now accessible via the toolbar, rather than in the Categories panel. Click on the bottom button on the toolbar to bring up Split View options:
It is now possible to segment t-SNE plots by any category through the Split View menu, even outside Categories mode.
Selecting Genes and Features from the Feature Table
In previous versions of Loupe Cell Browser, clicking on a gene in the gene table would add the gene to the "Heatmap List". In Loupe Cell Browser 3.0, clicking a gene (or other feature) in the table will instead bring up a menu of options.
From this menu, there are options to assign a feature to an existing list, or create a new list. Choosing Set as Active Feature will highlight the expression or accessibility of the feature in the current plot, as in previous versions of Loupe Cell Browser. Selecting Copy to Clipboard copies the feature name to the system clipboard, making it easier to paste into other bioinformatics tools.
Integrated Gene Expression + V(D)J Clonotype Analysis
When using the combined 5′ Gene Expression with T Cell and B Cell Enrichment Kits, it is now possible to measure whole transcriptome gene expression and V(D)J repertoire diversity from the same sample. To facilitate this analysis, Loupe Cell Browser 2.0 allows you to combine the V(D)J and gene expression data with a few clicks.
To find out more about how to conduct an integrated experiment, consult the Single Cell Gene Expression + V(D)J page. For a complete Loupe how-to including some example data, go to Integrated Gene Expression and V(D)J Analysis in Loupe Cell Browser.
The complete list of V(D)J features in Loupe Cell Browser includes:
- Import one or more .vloupe files (e.g, T and B cell data) into a single .cloupe workspace
- Save and share loaded clonotype lists into the .cloupe file
- Visual overlays indicating location of cells in the visible clonotype list
- Filter clonotype list by gene expression cluster, gene names, and CDR3 motifs
- Filter between one or all .vloupe files at a time
- Highlight individual clonotypes in the clonotype list
- Create and save new clusters from selected clonotypes
- Toggle between gene names and CDR3 sequences of chains
- On import, detect whether a V(D)J dataset is associated with the loaded gene expression data
Additional Significant Gene Options
Loupe Cell Browser 2.0.0 removes most limits on the set of genes returned by calculating significant genes, and gives you several filtering options. Click on the Options button on the Significant Genes panel to see all options.
Changes include:
- The list now includes all genes that are upregulated in a cluster, and have a mean expression level across the dataset of one transcript per cell or higher. Previous behavior was to return the top 20 upregulated genes per cluster.
- It is now the default to sort significant genes by p-value. You can also sort by regulation change compared to mean.
- View the top upregulated genes per cluster, downregulated genes per cluster, all significant genes per cluster, or limit comparison to genes in the currently visible Gene Expression list.
- Optionally disable the low average transcript count filter, to show the expression level of all genes detected in the sample.
- Choose the top number of genes to display when exporting to CSV.
- The heatmap will now display the top upregulated genes per cluster by p-value.
Additional Fixes
- Added "Gene Exp Min" as a coloring and filtering option in gene expression, allowing you to view cells in which Gene 1 AND Gene 2 AND Gene 3 are expressed.
- Add option to change background color to black, via the View menu.
- More prevalent links to help and the online tutorial.
- Auto-detect when a user may need to upgrade video drivers on Windows, instead of crashing.
- Trigger Save As... when attempting to save a read-only file.
- Change bundled tutorial to read-only.
Category Import and Export
We recognize that there are many scripts and packages in the single-cell analysis ecosystem, and that you may want to import and export labels into and out of Loupe Cell Browser. We've made this easy to do in Loupe Cell Browser 1.0.5. When Categories mode is active, simply click on the action button to the right of the active category name, and select from one of the import/export options. Video guide is available here.
The requirements on the CSV file are that barcodes must be in the first column, the first row must be a header, the barcode column header must be named barcode, and that the values of the barcodes must match at least a subset of the barcodes in the .cloupe file.
Here's an example that you can import into the AMLTutorial dataset bundled with Loupe Cell Browser. It's a set of manual annotations for the Patient sample. You can import multiple categories at once from a single CSV file; each column will encode its own category.
Renaming and Recoloring Clusters
You can now rename and recolor the clusters you create, or clusters automatically generated by the Cell Ranger pipeline. In Categories mode, right-click (Windows)or Ctrl-click (Mac) a label or color. A context menu will appear, and you'll be able to edit the cluster name or cluster color, as shown in the video here.
Changes to Cell Ranger-derived clusters will appear as separate clusterings to users of older versions of Loupe Cell Browser.
Additional Fixes
- Loupe Cell Browser will now correctly open files with '+' in the name.
- Outbound links to Ensembl gene information should look correctly formatted (Thanks, Ensembl team!)
- More consistent color palettes for precomputed and user-created categories.
- Adds version check to signal when new updates are available.
- Fixes issue that may block file opening and bug reporting when an HTTP proxy is active on a user's system.
- Fixes issue that may block file opening and bug reporting under certain custom network configurations.
Windows only
- Fixes critical error with uninstaller program introduced in v1.0.1 to safely remove Loupe Cell Browser 1.0.1 or 1.0.2)
- Fixes critical error with uninstaller program introduced in v1.0.1 to safely remove Loupe Cell Browser 1.0.1 or 1.0.2)
- Adds a legend to the color scale in gene expression view.
- Automatically removes clusters emptied as the result of manual assignment.
- Changes Windows installation; now prompts for the installation directory.
- Adds clearer copyright information, accessible from the Help menu.
- Fixed problem where gene expression points would appear the same color when using data derived from custom non-Ensembl references.
- Fixed problem where adding over 10 custom clusters per category would cause an error.
- Initial release.