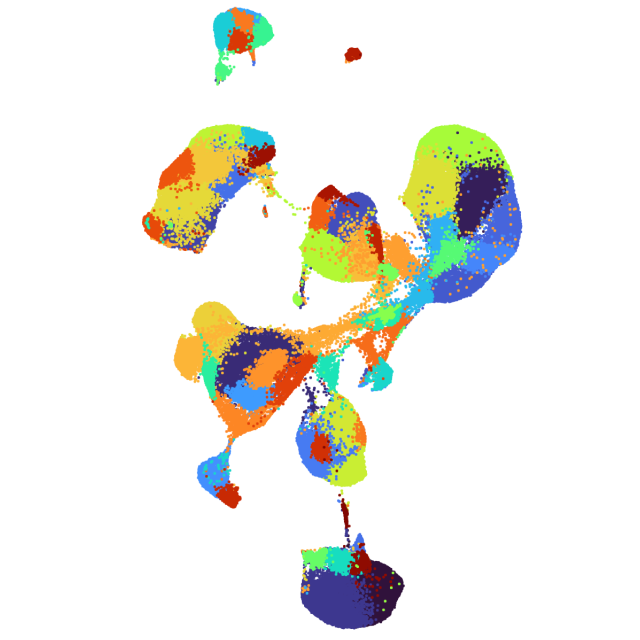
Full chip, mixture of drug treated H1975 and A549 cells, 3' HT v3.1
Universal 3' Gene Expression dataset analyzed using Cell Ranger 6.1.0

Learn about Chromium analysis
Human A549 and human H1975 cell lines were seeded in biological replicates on two 96 well plates. Cells were either untreated, or treated with various drugs (erlotinib, crizotinib, osimertinib, linsitinib, or combinations) for 4, 16, or 24 hours in technical replicates. Each treatment condition was CellPlexed. Technical replicates of both cell lines across each timepoint were pooled for each drug/drug combination.
Gene expression and CellPlex libraries were generated as described in the Chromium Next GEM Single Cell 3' HT Reagent Kits v3.1 User Guide with Feature Barcode technology for Cell Multiplexing (CG000419 Rev A) using the Chromium X. Libraries were sequenced on an Illumina NovaSeq 6000 to a read depth of approximately 30,000 mean reads per cell for gene expression and 15,000 mean reads per cell for CellPlex.
Paired-end, dual indexing Read 1: 28 cycles (16 bp barcode, 12 bp UMI) i5 index: 10 cycles (sample index) i7 index: 10 cycles (sample index) Read 2: 90 cycles (transcript).
Data were analyzed as follows:
- GEX and CellPlex libraries for each GEM well were analyzed with cellranger multi; --expect-cells=60000; GEX reference: GRCh38-2020A.
- The results were combined using cellranger aggr.
FASTQ files: Due to the large size of the data, the raw FASTQ data will not be available directly from our website. Users can pay to download the raw FASTQ data from Amazon S3 at their cost. The instructions to download the FASTQs are here.
Note: this dataset has Low Post-Normalization Read Depth because there is a large discrepancy in sequencing depth among the input libraries.
This dataset is licensed under the Creative Commons Attribution 4.0 International (CC BY 4.0) license. 10x citation guidelines available here.
