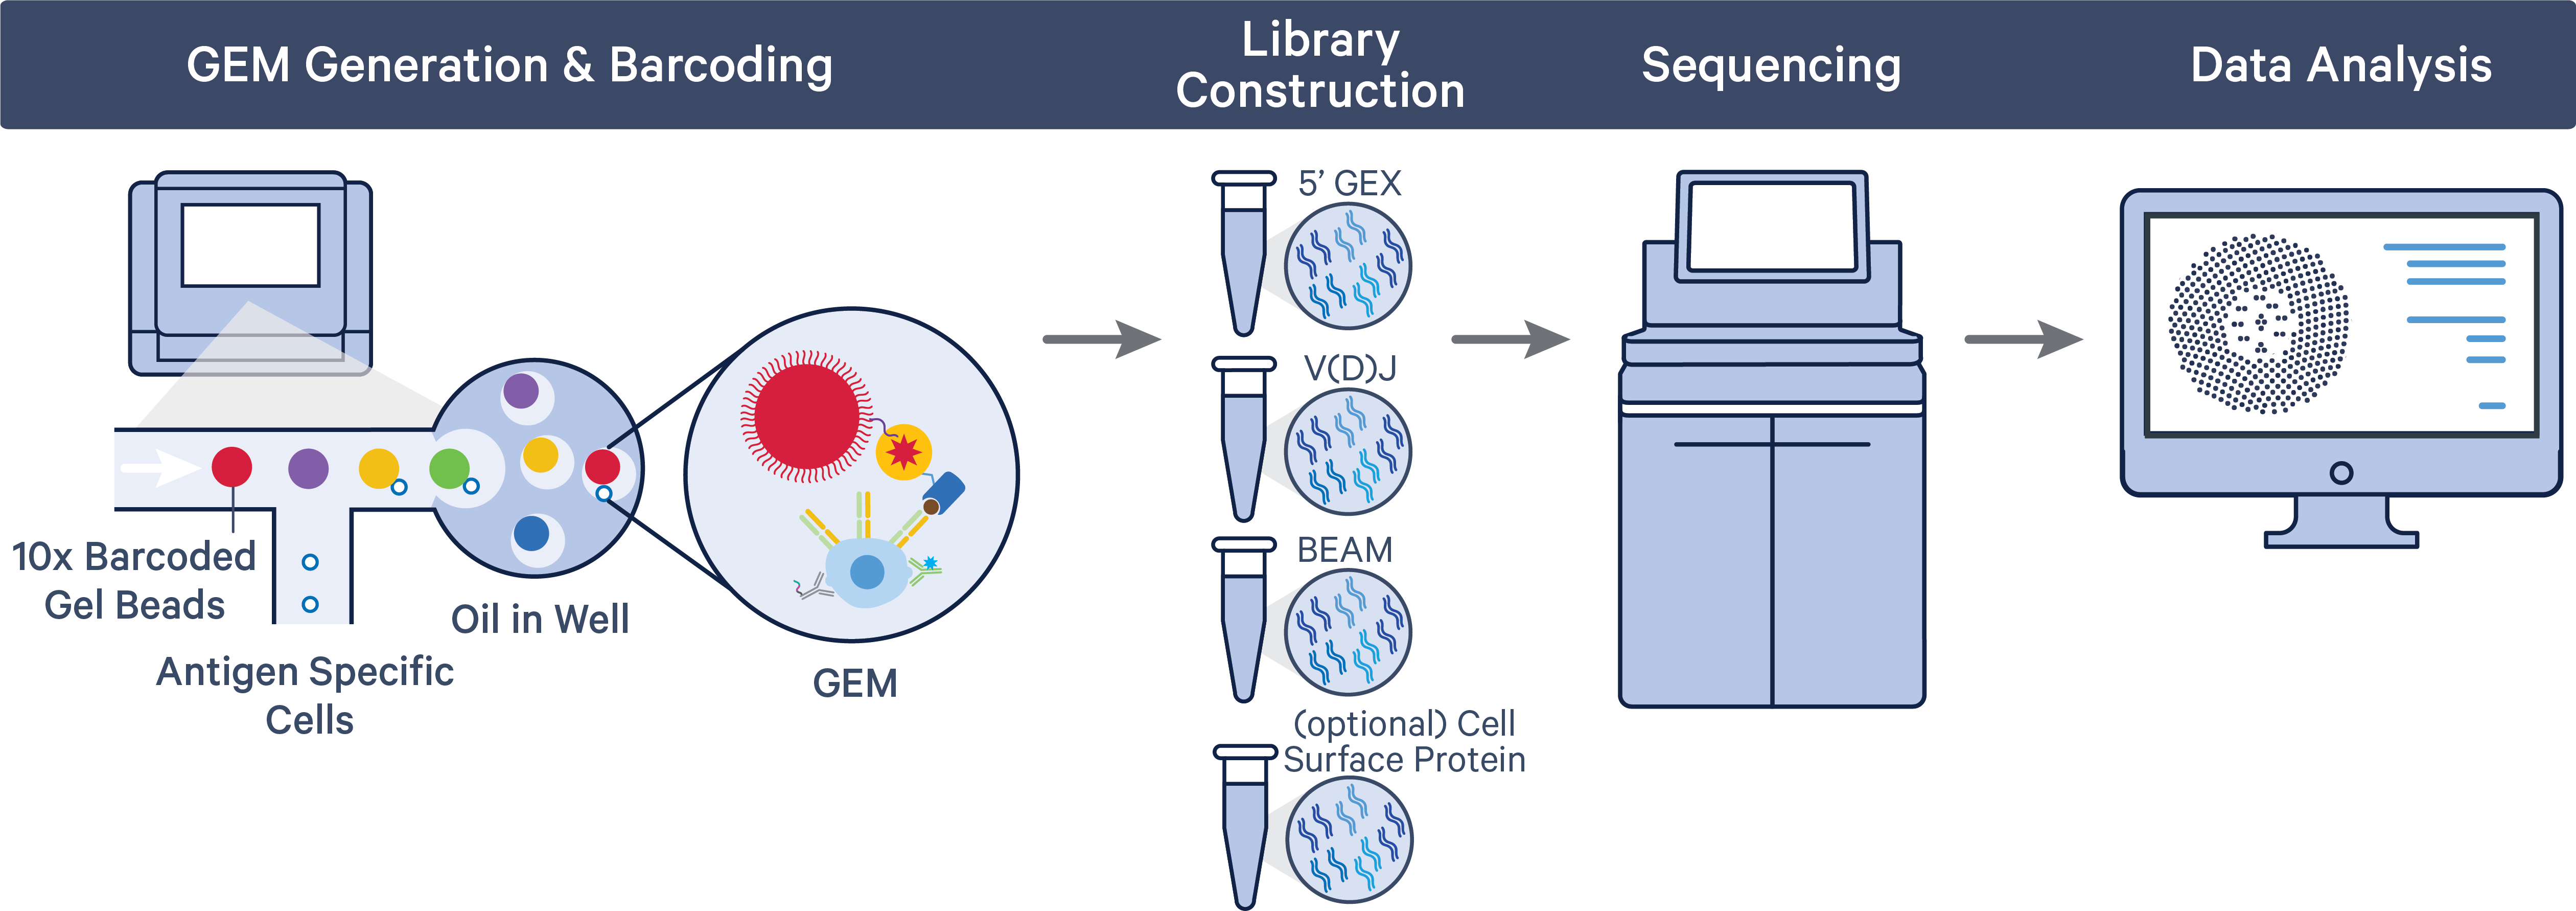
The Chromium Single Cell 5' Barcode Enabled Antigen Mapping (BEAM) with Feature Barcode technology offers a comprehensive, scalable approach to detect cell surface proteins and map antigens along with the gene expression and immune repertoire information from the same single cells.
With the BEAM workflow, it is possible to profile full-length, paired T cell receptor (TCR) or B cell receptor (BCR) transcripts, and map antigens and cell surface proteins from 500-10,000 individual cells per sample.
The BEAM-Ab or BCR Antigen Capture workflow starts with the assembly of the BEAM Conjugate (part of 10x Genomics Reagent Kits), containing a Feature Barcode oligonucleotide, with the appropriate antigens. Samples are labeled with assembled BEAM reagents and flow sorted to collect antigen-specific B cells.

Unlike BCRs, TCRs need antigenic peptides to be presented to them on specialized molecules called major histocompatibility complex (MHC) proteins. Before TCR-peptide binding, the BEAM-T workflow requires researchers to mix their peptides with a BEAM Conjugate bound to an MHC monomer. Cells can then be flow sorted to collect antigen-specific T cells, similar to the BCR Antigen Capture workflow.

A pool of ~750,000 barcodes is sampled separately to index each cell’s transcriptome and antigen specificity. This is done by partitioning thousands of cells into nanoliter-scale Gel Beads-in-emulsion (Gel Beads-in-emulsion), where all generated cDNA/DNA (from polyadenylated mRNA, Antigen Capture, and cell surface protein Feature Barcode) share a common 10x Barcode. Libraries are generated and sequenced, and 10x Barcodes are used to associate individual reads back to the individual partitions.

Single Cell 5' v2 dual index libraries must be sequenced with the following read configuration and sequencing depth:
| Library name | Read configuration (bp) Read 1, i7, i5, Read 2 | Recommended sequencing depth(reads/cell) |
|---|---|---|
Antigen Capture | 26, 10, 10, 90 | 5000 |
VDJ | 26, 10, 10, 90 | 5000 |
Gene Expression | 26, 10, 10, 90 | ~5,000 reads/cell is a suggested starting point; the minimum GEX depth needed for cell calling may vary based on the sample type and data quality. |
The Cell Ranger software can be used to analyze Antigen Capture data after sequencing. First, BCL files must be converted to FASTQ format using cellranger mkfastq or one of Illumina's BCL conversion software, BCL Convert or bcl2fastq.
The cellranger multi pipeline can ingest and process FASTQ files from Gene Expression, V(D)J, and Antigen Capture (+ Antibody Capture) libraries. Visit the Antigen Capture (multi) page under the Running Pipelines section to learn about configuring cellranger multi for Antigen Capture data.

The pipeline outputs antigen specificity scores along with all the regular cellranger multi outputs. Details on how Cell Ranger calculates the antigen specificity score are described on the antigen algorithm page.
The Cell Ranger pipeline outputs a .cloupe and .vloupe file that can be imported into Loupe Browser and Loupe V(D)J Browser, respectively.
Using Loupe Browser, users can visualize gene expression clusters, overlay clonotype information, and group cells by antigen specificity scores.
Using Loupe V(D)J Browser, you can visualize clonotype grouping, filter clonotypes and cells based on antigen specificity scores (in addition to other variables), and export a list of the filtered clonotypes in CSV format. A step-by-step tutorial on using the Loupe V(D)J Browser v5.0 to visualize Antigen Capture data is available.
- Experiment planning guide: Plan your assay workflow by referring to the list of equipment, kits, and reagents needed to perform a BEAM-T or BEAM-Ab assay.
- BEAM sample prep guide: Detailed guide on preparing single cell suspensions needed for GEM generation.
- BEAM user guides: Assay protocols to generate BEAM-Ab and BEAM-T libraries along with Gene Expression, V(D)J, and an optional Antibody Capture library.
- Chromium Next GEM Single Cell 5’ Reagent Kits v2 (Dual Index) with Feature Barcode Technology for Barcode Enabled Antigen Mapping (BEAM)
- Chromium Next GEM Single Cell 5’ Reagent Kits v2 (Dual Index) with Feature Barcode Technology for Barcode Enabled Antigen Mapping (BEAM) & Cell Surface Protein
- Chromium Next GEM Single Cell 5' HT Reagent Kits v2 (Dual Index) with Feature Barcode technology for Barcode Enabled Antigen Mapping (BEAM)
- Chromium Next GEM Single Cell 5' HT Reagent Kits v2 (Dual Index) with Feature Barcode technology for Barcode Enabled Antigen Mapping (BEAM) and Cell Surface Protein
- Feature Barcode technology: Learn more about 10x Genomics Feature Barcode technology for immune profiling.
- Antigen Capture analysis: Learn how to set up all the input files needed to process Antigen Capture libraries using the
cellranger multipipeline. - Understanding antigen outputs: Learn about
cellranger multioutput file structure and understand all the output files generated after a successfulmultirun. - The antigen algorithm: Learn how Cell Ranger calculates antigen specificity scores.
- Loupe V(D)J Browser tutorial: Learn how to visualize and explore clonotypes based on antigen specificity scores.