How imaging- and sequencing-based spatial transcriptomics add new dimensions to your research

Editor’s Note: The purpose of this piece is to provide background on the value of RNA as an analyte and how spatial transcriptomics can make a difference in your work. If you’re looking for a comparison of available 10x spatial technologies, we have an in-depth guide available here.
mRNA profiling and high-content imaging were the two technologies that were most likely to be listed as game-changers by researchers in a 2020 survey. Now, you can combine and amplify the strengths of both with imaging- and sequencing-based spatial transcriptomics.
We wrote this blog not just to tell you how this technology will benefit your research, but to show you. For example, here’s what you can see with whole transcriptome analysis at single cell scale:
In Figure 1, 2 µm x 2 µm barcoded squares captured gene expression across this entire tissue section, bringing tissue features, structures, morphology, and pathology to life for unbiased and unmatched discovery-based research. But what if you needed a more targeted approach?
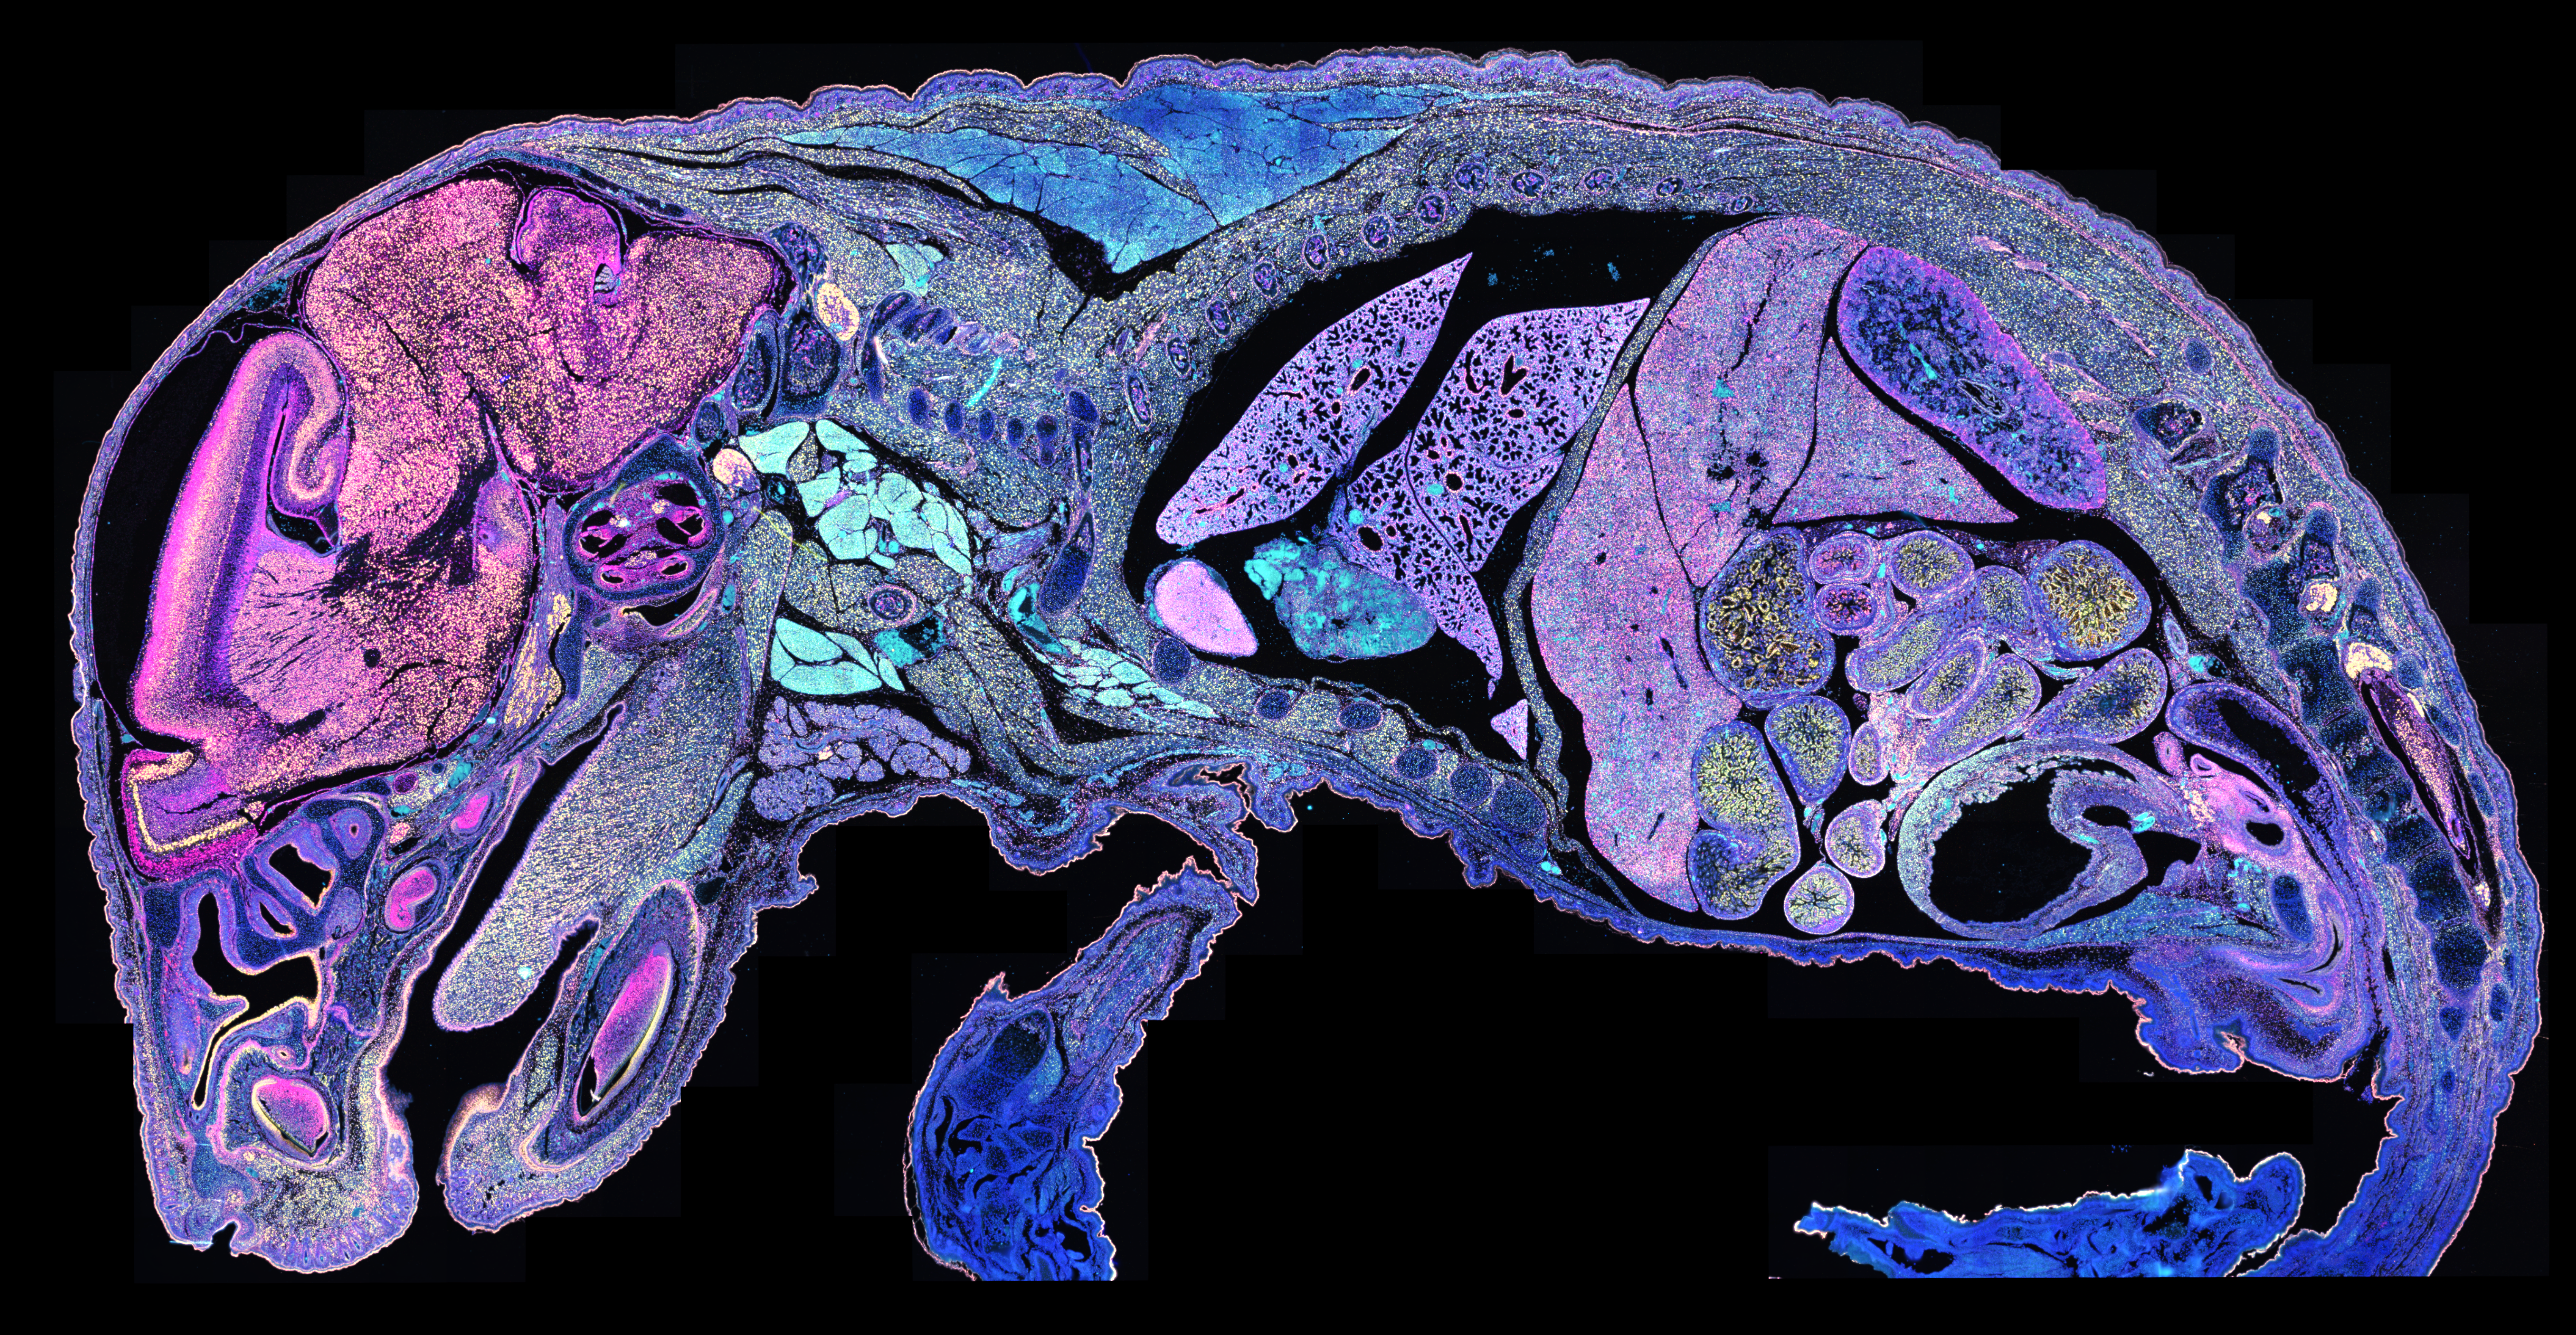
What you see in Figure 2 isn’t immunofluorescence—it’s RNA analyzed with the Xenium In Situ platform. Specifically, it’s 177 million transcripts from 1.4 million cells visualized across an entire single tissue section, combined to identify specific cell types (denoted by color) that then reveal specific tissues and structures. Now let’s zoom in on a new section, where you can see individual RNA transcripts at subcellular resolution:
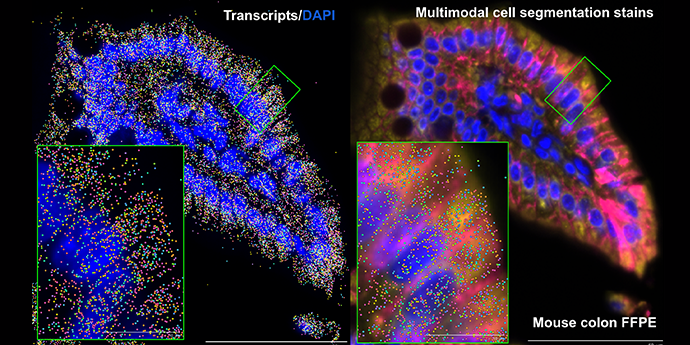
It’s visually impressive, but more than that—it’s powerful. Spatial transcriptomics combines the ability to analyze hundreds to thousands of genes simultaneously with, depending on your platform, integrated cell segmentation and/or subcellular resolution. It gives you the power to tease apart not just individual cells, but how they’re communicating with their neighbors, how specific cellular neighborhoods are reacting in health and disease, and so much more.
Read on to see how.
Spatial transcriptomics unlocks greater insights into cell types and states
*Key takeaway: Spatial transcriptomics offers a clearer picture of cell types and states with hundreds to thousands of gene measurements per cell, helping you find the best markers for your cell types of interest to complement and augment your existing tools.*
Cells are defined by the specific complement of genes they express. In the past, researchers typically relied on one (or several) protein and/or RNA markers to characterize entire cell populations. However, this approach carries the risk of choosing suboptimal marker(s) for your cells of interest or combining heterogeneous cells together based on a single marker. It can’t resolve the myriad of cell states in biological systems and their localization. But high-plex and whole transcriptome spatial transcriptomics can:
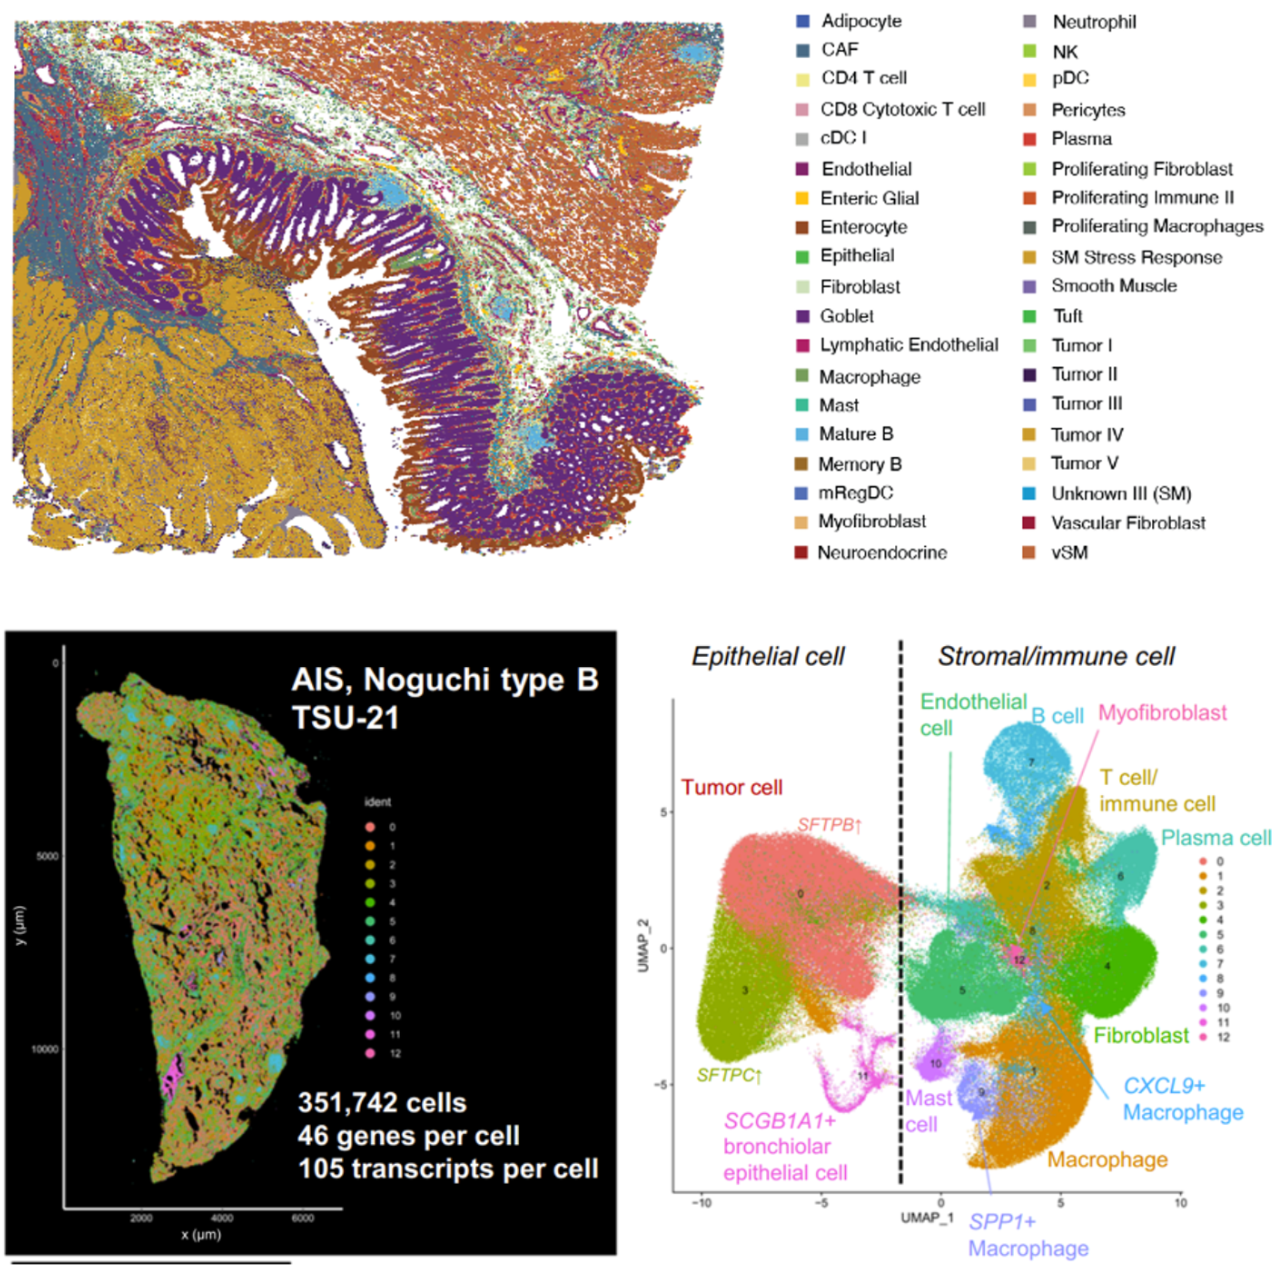
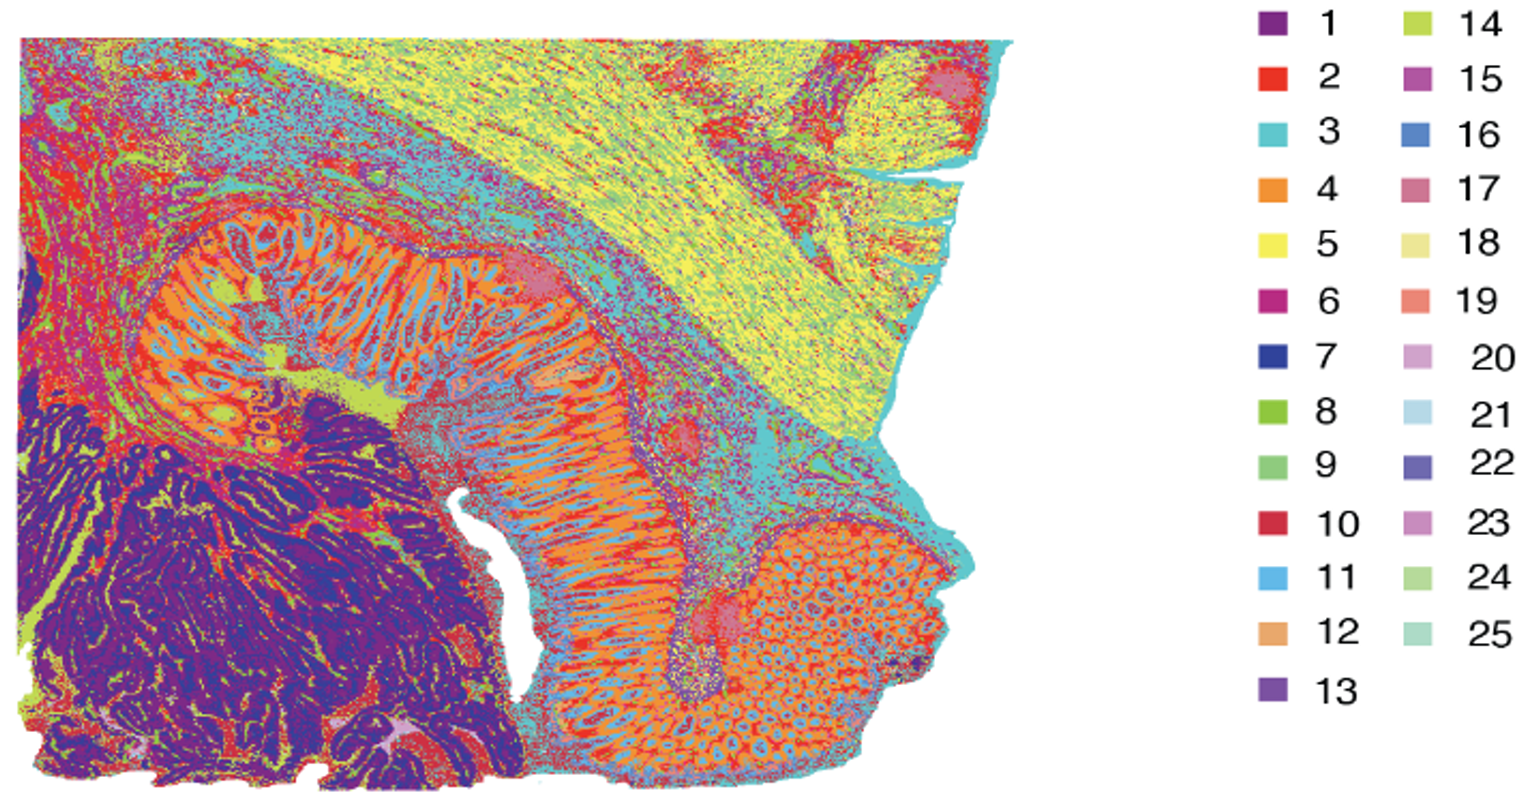
While the technologies differ in Figure 4 (and you can learn more about their differences and strengths here), the approaches are both similar and powerful: each platform lets researchers visualize transcripts localized to a specific feature (2x2 µm bins [Figure 4A] or single cells [Figure 4B]).
Integrated bioinformatics tools “bin” similar features (corresponding to cell types) together, then give each cell type a unique color and plot them across tissue to see how these cell types cluster together. This approach is particularly valuable in mapping cellular neighborhoods across tissue sections (Figure 5).
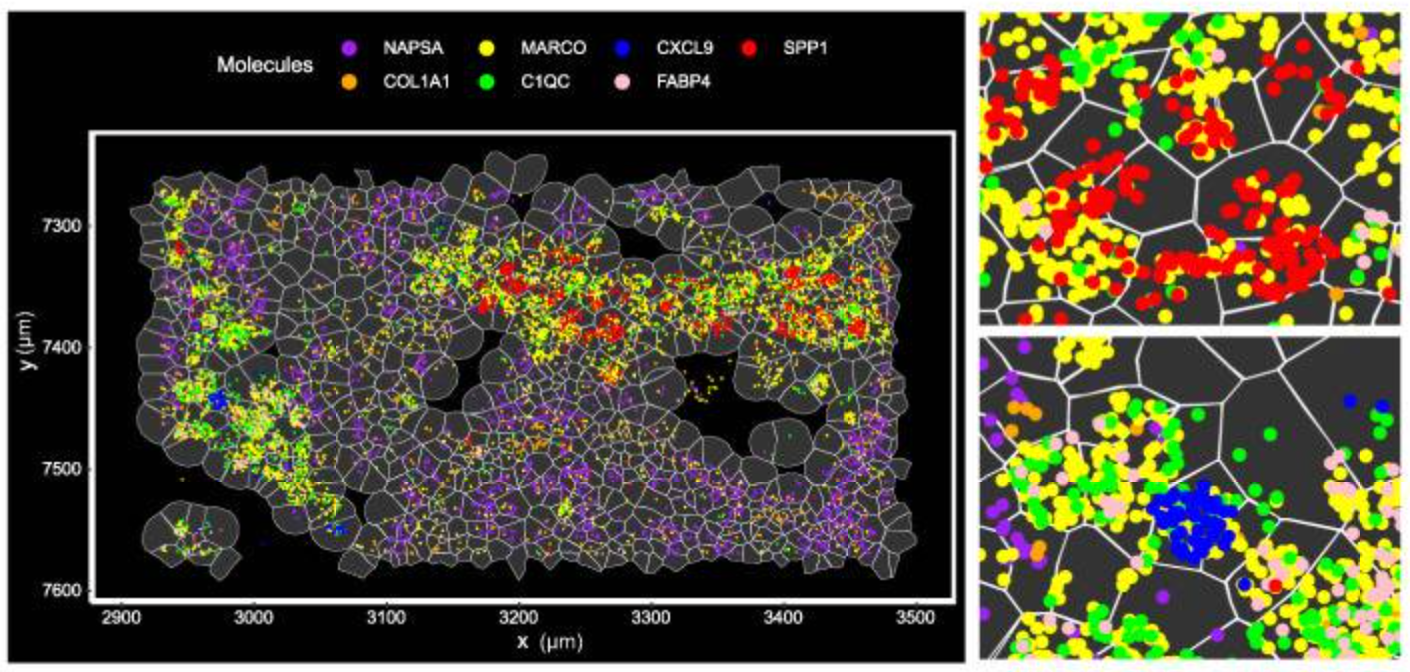
Note: The cell segmentation used in Figure 5 represents an early version of segmentation on Xenium. The preferred cell segmentation approach now uses multiple morphological stains for the boundary and interior and leverages a purpose-built algorithm for accurate segmentation. More information on the current Xenium cell segmentation approach can be found here.
In Figure 5, the researchers demonstrated how imaging-based spatial transcriptomics can better discriminate subpopulations of cells by using a marker of lung macrophages—MARCO (yellow)—as an example. Using their rich dataset, they were able to characterize, de novo, a variety of different MARCO+ lung macrophages in their tissue. Notably, two of these subtypes (FABP4+ and SPP1+) had potential clinical significance, given they, “...affect fibroblasts in the vicinity and may cause alveolar collapse,” a more macro-level change linked to lung structure and function.
How this benefits your work: Spatial transcriptomics lets you see more genes, which gives you more data points to identify cell types/states and their localization in your tissue. This can serve as an endpoint of your study by shedding light on the underlying biology of your tissue, or by helping you select better complements of markers for more focused proteomics studies.
Spatial transcriptomics enables a new dimension of biomarkers by examining spatial relationships
*Key takeaway: Biomarkers aren’t just a “what” but a “where.” Spatial transcriptomics lets you analyze spatial relationships between cells and/or phenomena that can provide actionable biomarkers in a way that can’t be done with single cell analyses alone.*
While biomarkers are often thought of as a differentially expressed gene, a cell type, or something similar, it’s also critical to consider spatial context.
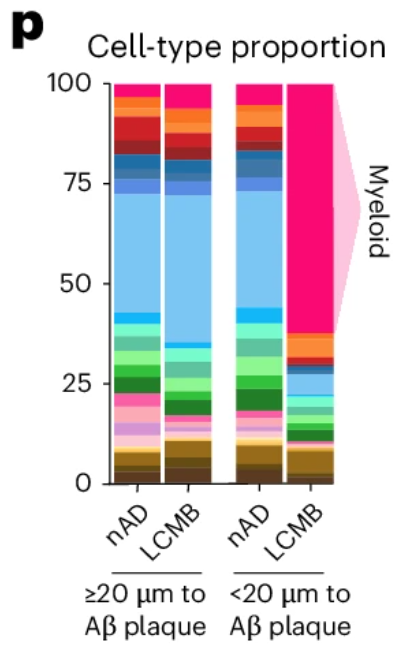
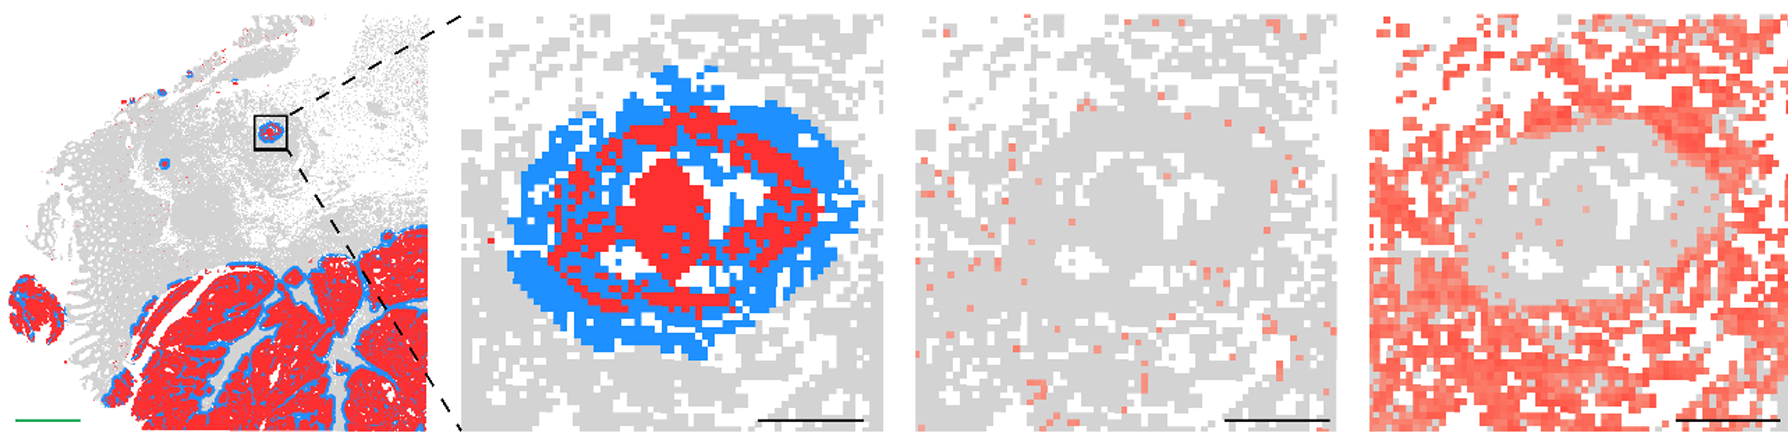
A compelling example of why came from a recent study examining amyloid clearance in non-immunized and immunized patients with Alzheimer’s disease (Figure 6). In both groups, cell composition remained largely similar when looking at cells >20 µm from amyloid plaques. When looking at cells <20 µm from plaques, non-immunized cell composition was largely unchanged, but immunized patients experienced a dramatic increase (>50% of total cells) in myeloid cells, highlighting the importance of spatial localization when examining drug responses.
But not all spatial biomarkers are based on cell composition. Another study investigated biomarkers associated with response to immune checkpoint inhibition (ICI) in bladder cancer (6). Using both Visium and Xenium assays, the researchers found that overall cell composition was largely unchanged in both groups—but that responders had a shorter distance between immune and epithelial cells than non-responders did, consistent with the notion that immune cell spatial localization was associated with ICI success.
How this benefits your work: Spatial transcriptomics adds another dimension to your biomarker studies by enabling spatial localization of specific cells and/or phenomena, giving you more information from your precious samples and letting you see information that’s inaccessible with legacy and single cell sequencing methods.
Spatial transcriptomics allows deeper characterization of how cells connect and communicate
*Key takeaway: RNA helps resolve complex biology with a richer characterization of what’s going on at the molecular, cellular, and tissue levels.*
Cells that touch talk to each other. Understanding not just what’s going on in an individual cell, but in its neighbors—and how they all communicate as a unit—is critical to capturing the bigger picture of the underlying biology of your tissue.
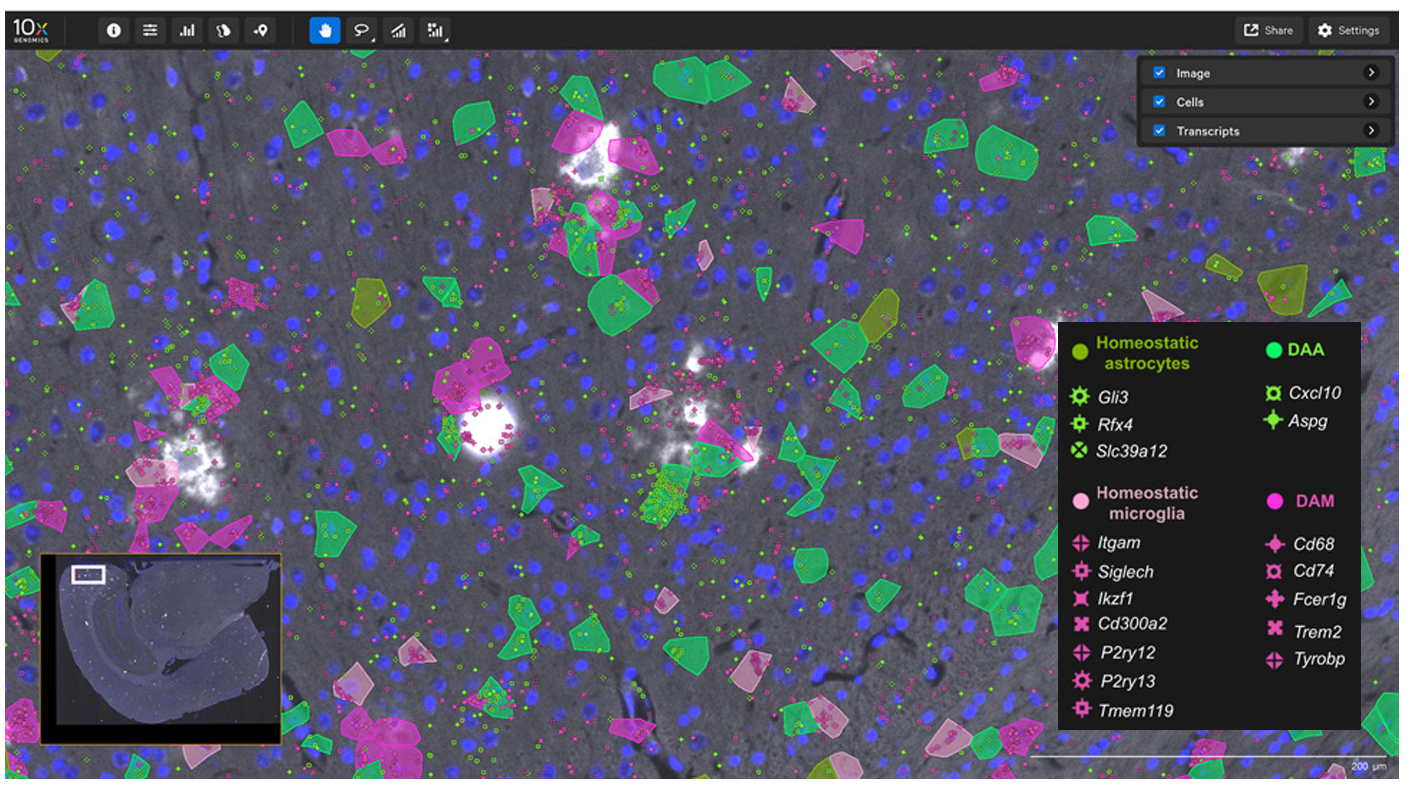
While legacy methods permit assaying markers to perform neighborhood and ligand–receptor analyses, high-plex single cell spatial RNA analyses help expand this by adding orders of magnitude more markers (Figure 7).
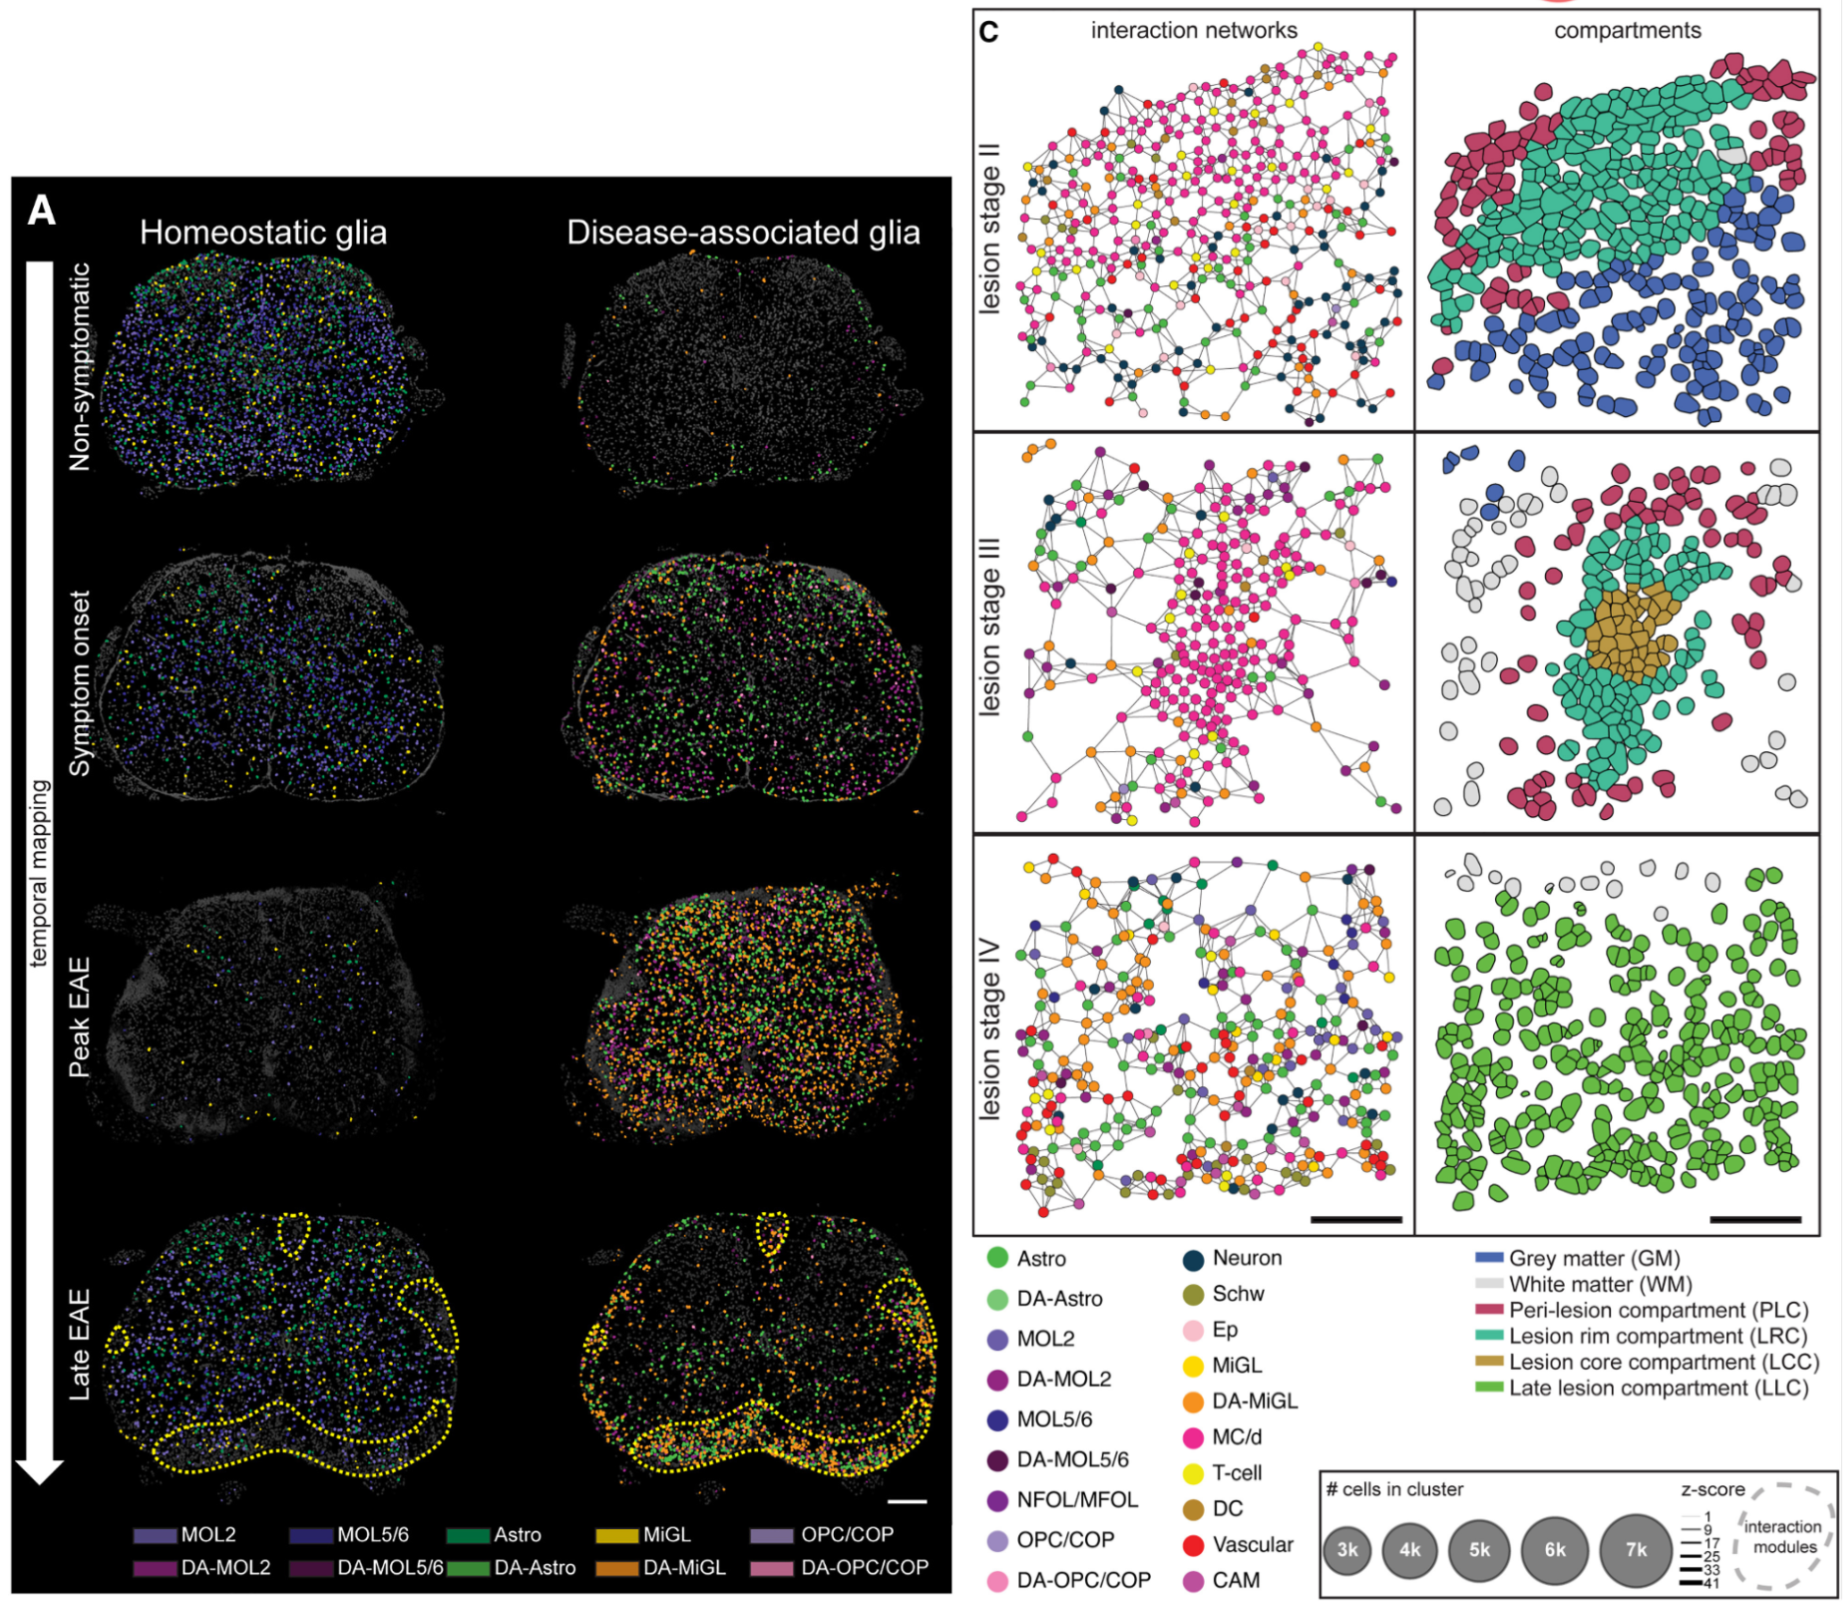
In this 2024 publication, researchers leveraged high-plex spatial RNA analysis to examine multiple sclerosis lesions in the spinal cord (3). First, they identified disease-associated (DA) glia in the spinal cord (Figure 7A), then they used both cell proximity and gene expression to create interaction networks for each cell in lesion “compartments” (Figure 7B). Ligand–receptor analyses then showed that DA microglia may influence DA oligodendrocytes and contribute to the dysregulation of these (and other) cell types in multiple sclerosis.
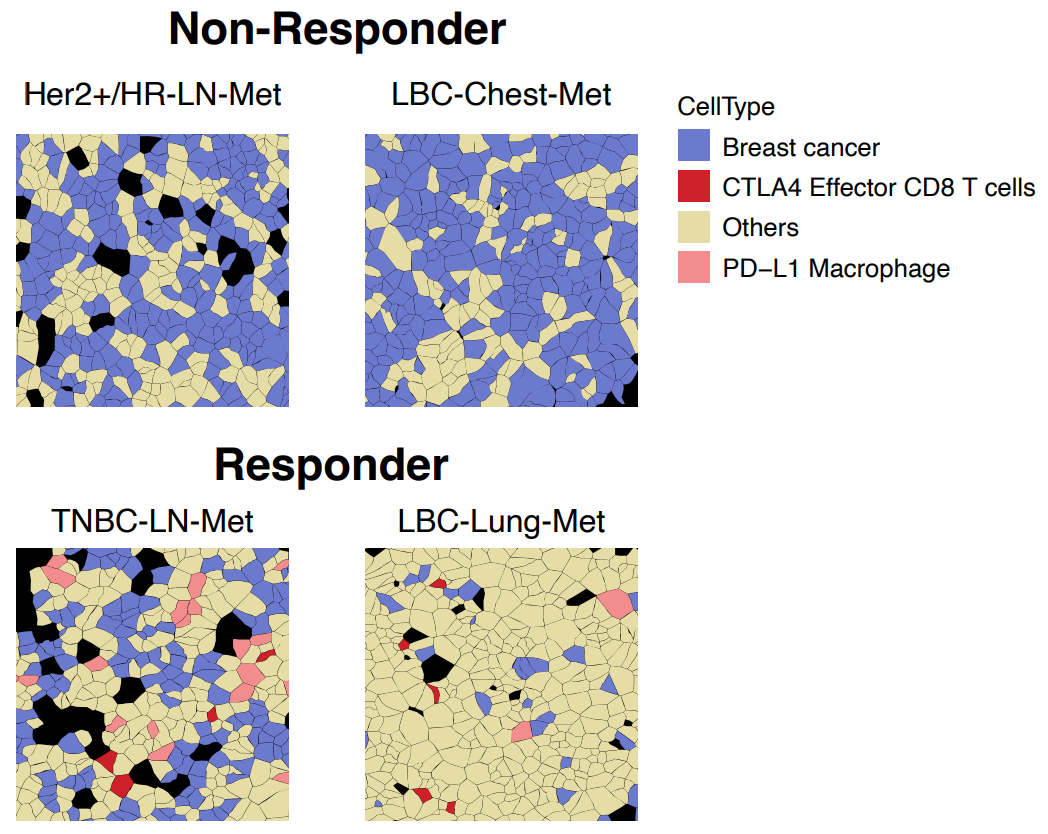
A second example came from Fynn Biotechnologies, where researchers used Xenium spatial transcriptomics to compare immunotherapy responder and non-responder breast cancer patients (3). Among the multitude of cell types were two populations, CTLA4+/CD8+ effector T cells and PD-L1+ macrophages, that only colocalized with breast cancer cells in responder patients (Figure 8).
Finally, unbiased sequencing-based spatial transcriptomics lets you screen for cellular and tissue organization in your tissue of interest, such as in this example, where the Visium HD assay is used to view the organization of peripheral versus tumor tissue and examine putative C1QC (macrophage) and COL1A1 (fibroblast)interactions:
How this benefits your work: In-depth characterization of cell types, and seeing how they colocalize with other cells, enables spatial transcriptomics to give you both broader and deeper insights into cell–cell communication and a better understanding of tissue microenvironments and cell neighborhoods.
Spatial transcriptomics offers more comprehensive datasets from your samples, without sacrificing your current analytes
*Key takeaway: Both the Xenium and Visium HD platforms are compatible with same-section H&E staining and immunofluorescence for true multiomics analysis.*
Spatial transcriptomic analyses are great. They’re even better when you can keep your current analysis methods and simply get more from your tissue. For example, look at these clips of the Visium HD and Xenium assays:
Imagine the above video is an analysis of your own tissue samples. Your tissue was previously stained with H&E and then imaged (or, for sequencing-based spatial transcriptomics, sequenced and overlaid). Combine this with the ability to get immunofluorescence (IF)* data (Figure 10), and adding RNA to your typical workflows means far richer datasets from your tissue samples without sacrificing your current analytes.
*Post-Xenium IF can be performed following a recent Technical Note, and up to 16-plex immunofluorescence staining was demonstrated on post-Xenium tissue in Watson et al. 2024 (4).
How this benefits your work: Histology offers valuable insights, but it’s comparatively low-resolution. Protein is an important analyte, but it’s typically low-plex. Using a spatial transcriptomics platform from 10x Genomics means you can combine the strengths of histology and protein with high-plex or whole transcriptome RNA, giving you more information from your samples without taking away any of your existing analytes.
Conclusion
The examples presented here showcase how incorporating spatial transcriptomics into your work can offer transformative insights into tissue biology by giving you a richer understanding of cellular communication, cell types, and disease mechanisms without sacrificing your current analytes and methods. We invite you to explore the strengths and best use cases of each of our current platforms in another blog, or reach out to an expert to take the next step in your spatial journey.
Questions? Contact sales.
References:
- Oliveira MF, et al. Characterization of immune cell populations in the tumor microenvironment of colorectal cancer using high definition spatial profiling. bioRxiv (2024). doi: /10.1101/2024.06.04.597233
- Haga Y, et al. Whole-genome sequencing reveals the molecular implications of the stepwise progression of lung adenocarcinoma. Nat Commun (2023). doi: 10.1038/s41467-023-43732-y
- Kukanja P, et al. Cellular architecture of evolving neuroinflammatory lesions and multiple sclerosis pathology. Cell (2024). doi: 10.1016/j.cell.2024.02.030
- Wang N, et al. Spatial single-cell transcriptomic analysis in breast cancer reveals potential biomarkers for PD1 blockade therapy. Research Square (preprint) (2024). doi: 10.21203/rs.3.rs-4376986/v2
- van Ost L et al. Microglial mechanisms drive amyloid-β clearance in immunized patients with Alzheimer's disease. Nat Med (2025). doi: 10.1038/s41591-025-03664-0
- Grande E, et al. Spatial biomarkers of response to neoadjuvant therapy in muscle-invasive bladder cancer: the DUTRENEO trial. medRxiv (2025). doi: 10.1101/2025.02.07.25321742
About the author: