For supported Visium v1/v2 datasets, the spaceranger aggr pipeline can be used to combine datasets from different capture areas or different slides. First, the spaceranger count pipeline is run separately for each library, then specific output files derived from each library are input to spaceranger aggr. Users can also run spaceranger aggr to create custom categories for specific experimental designs. Loupe Browser enables users to view these combined datasets, including any custom categories, and perform comparative analyses among multiple samples.
In this tutorial you will learn how to:
- Visualize aggregated Visium data (v1/v2) in Loupe Browser
- Perform a differential expression analysis between two serial sections from the same tissue block
Once you have downloaded and installed Loupe Browser, download the tutorial dataset. We will be analyzing a mouse brain .cloupe file from an aggregate of mouse brain sections run on Visium CytAssist Spatial Gene Expression (Visium v2). Download the Loupe Browser file under the Output and supplemental files tab, then open it in Loupe Browser.
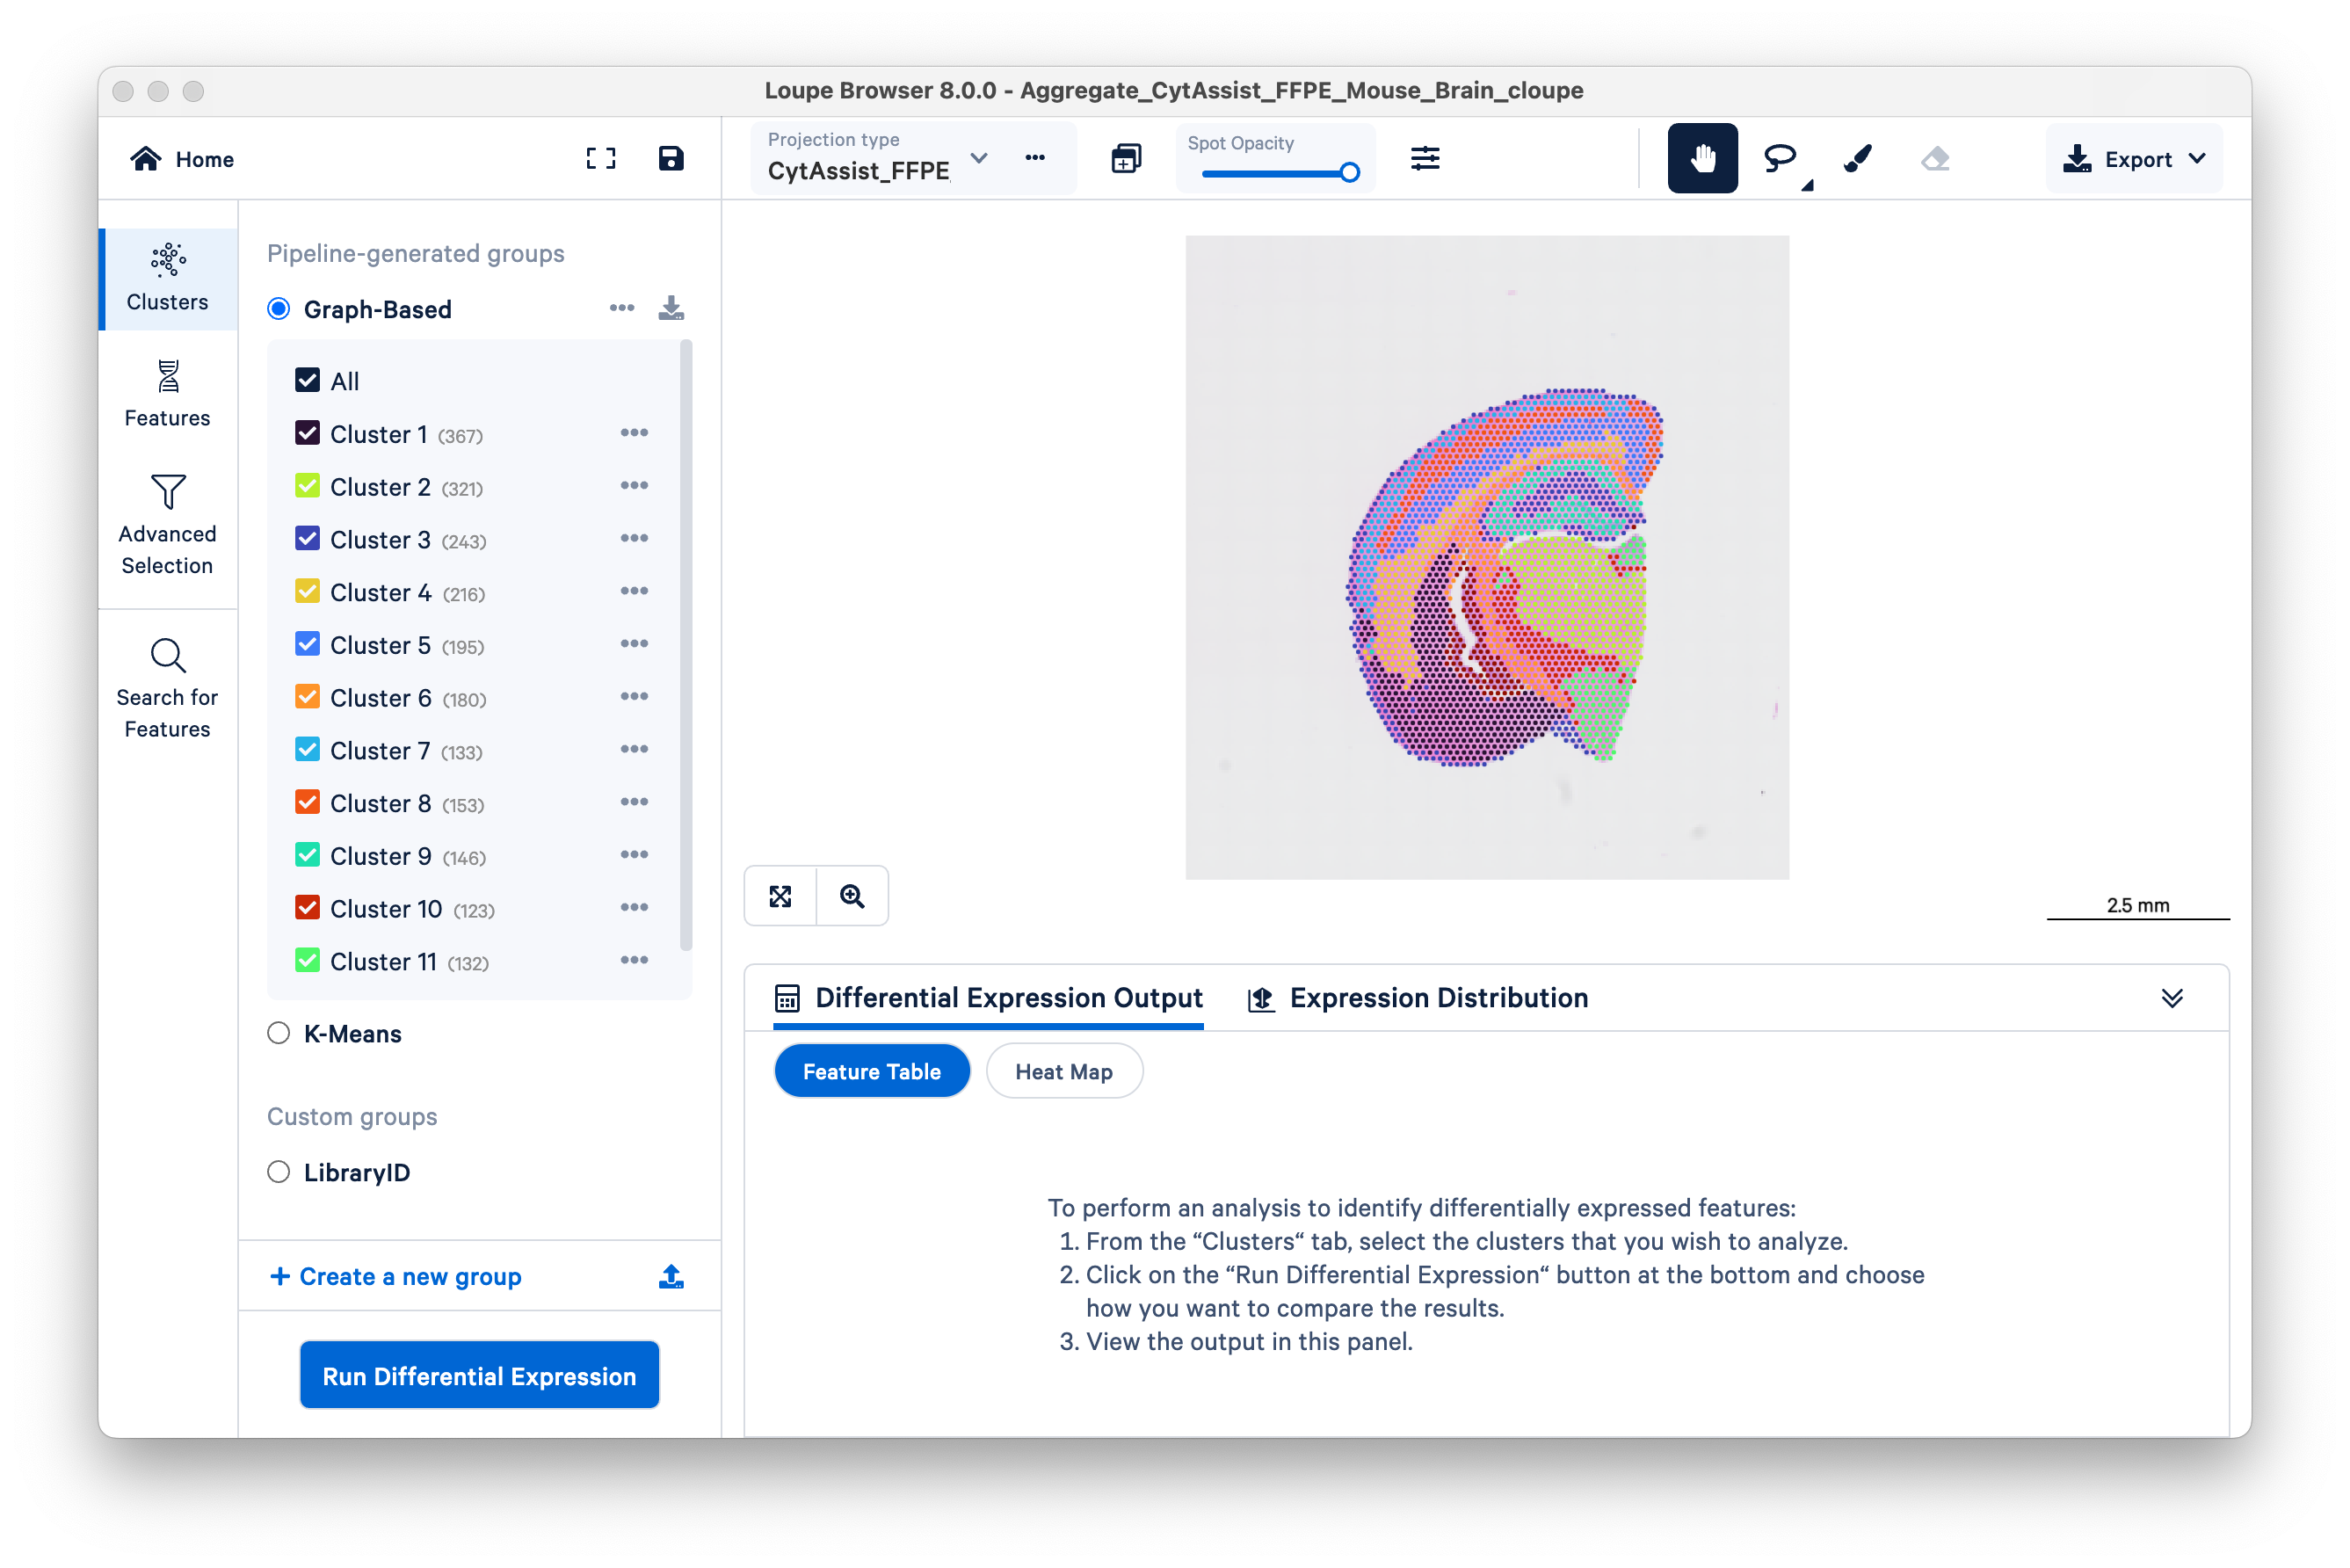
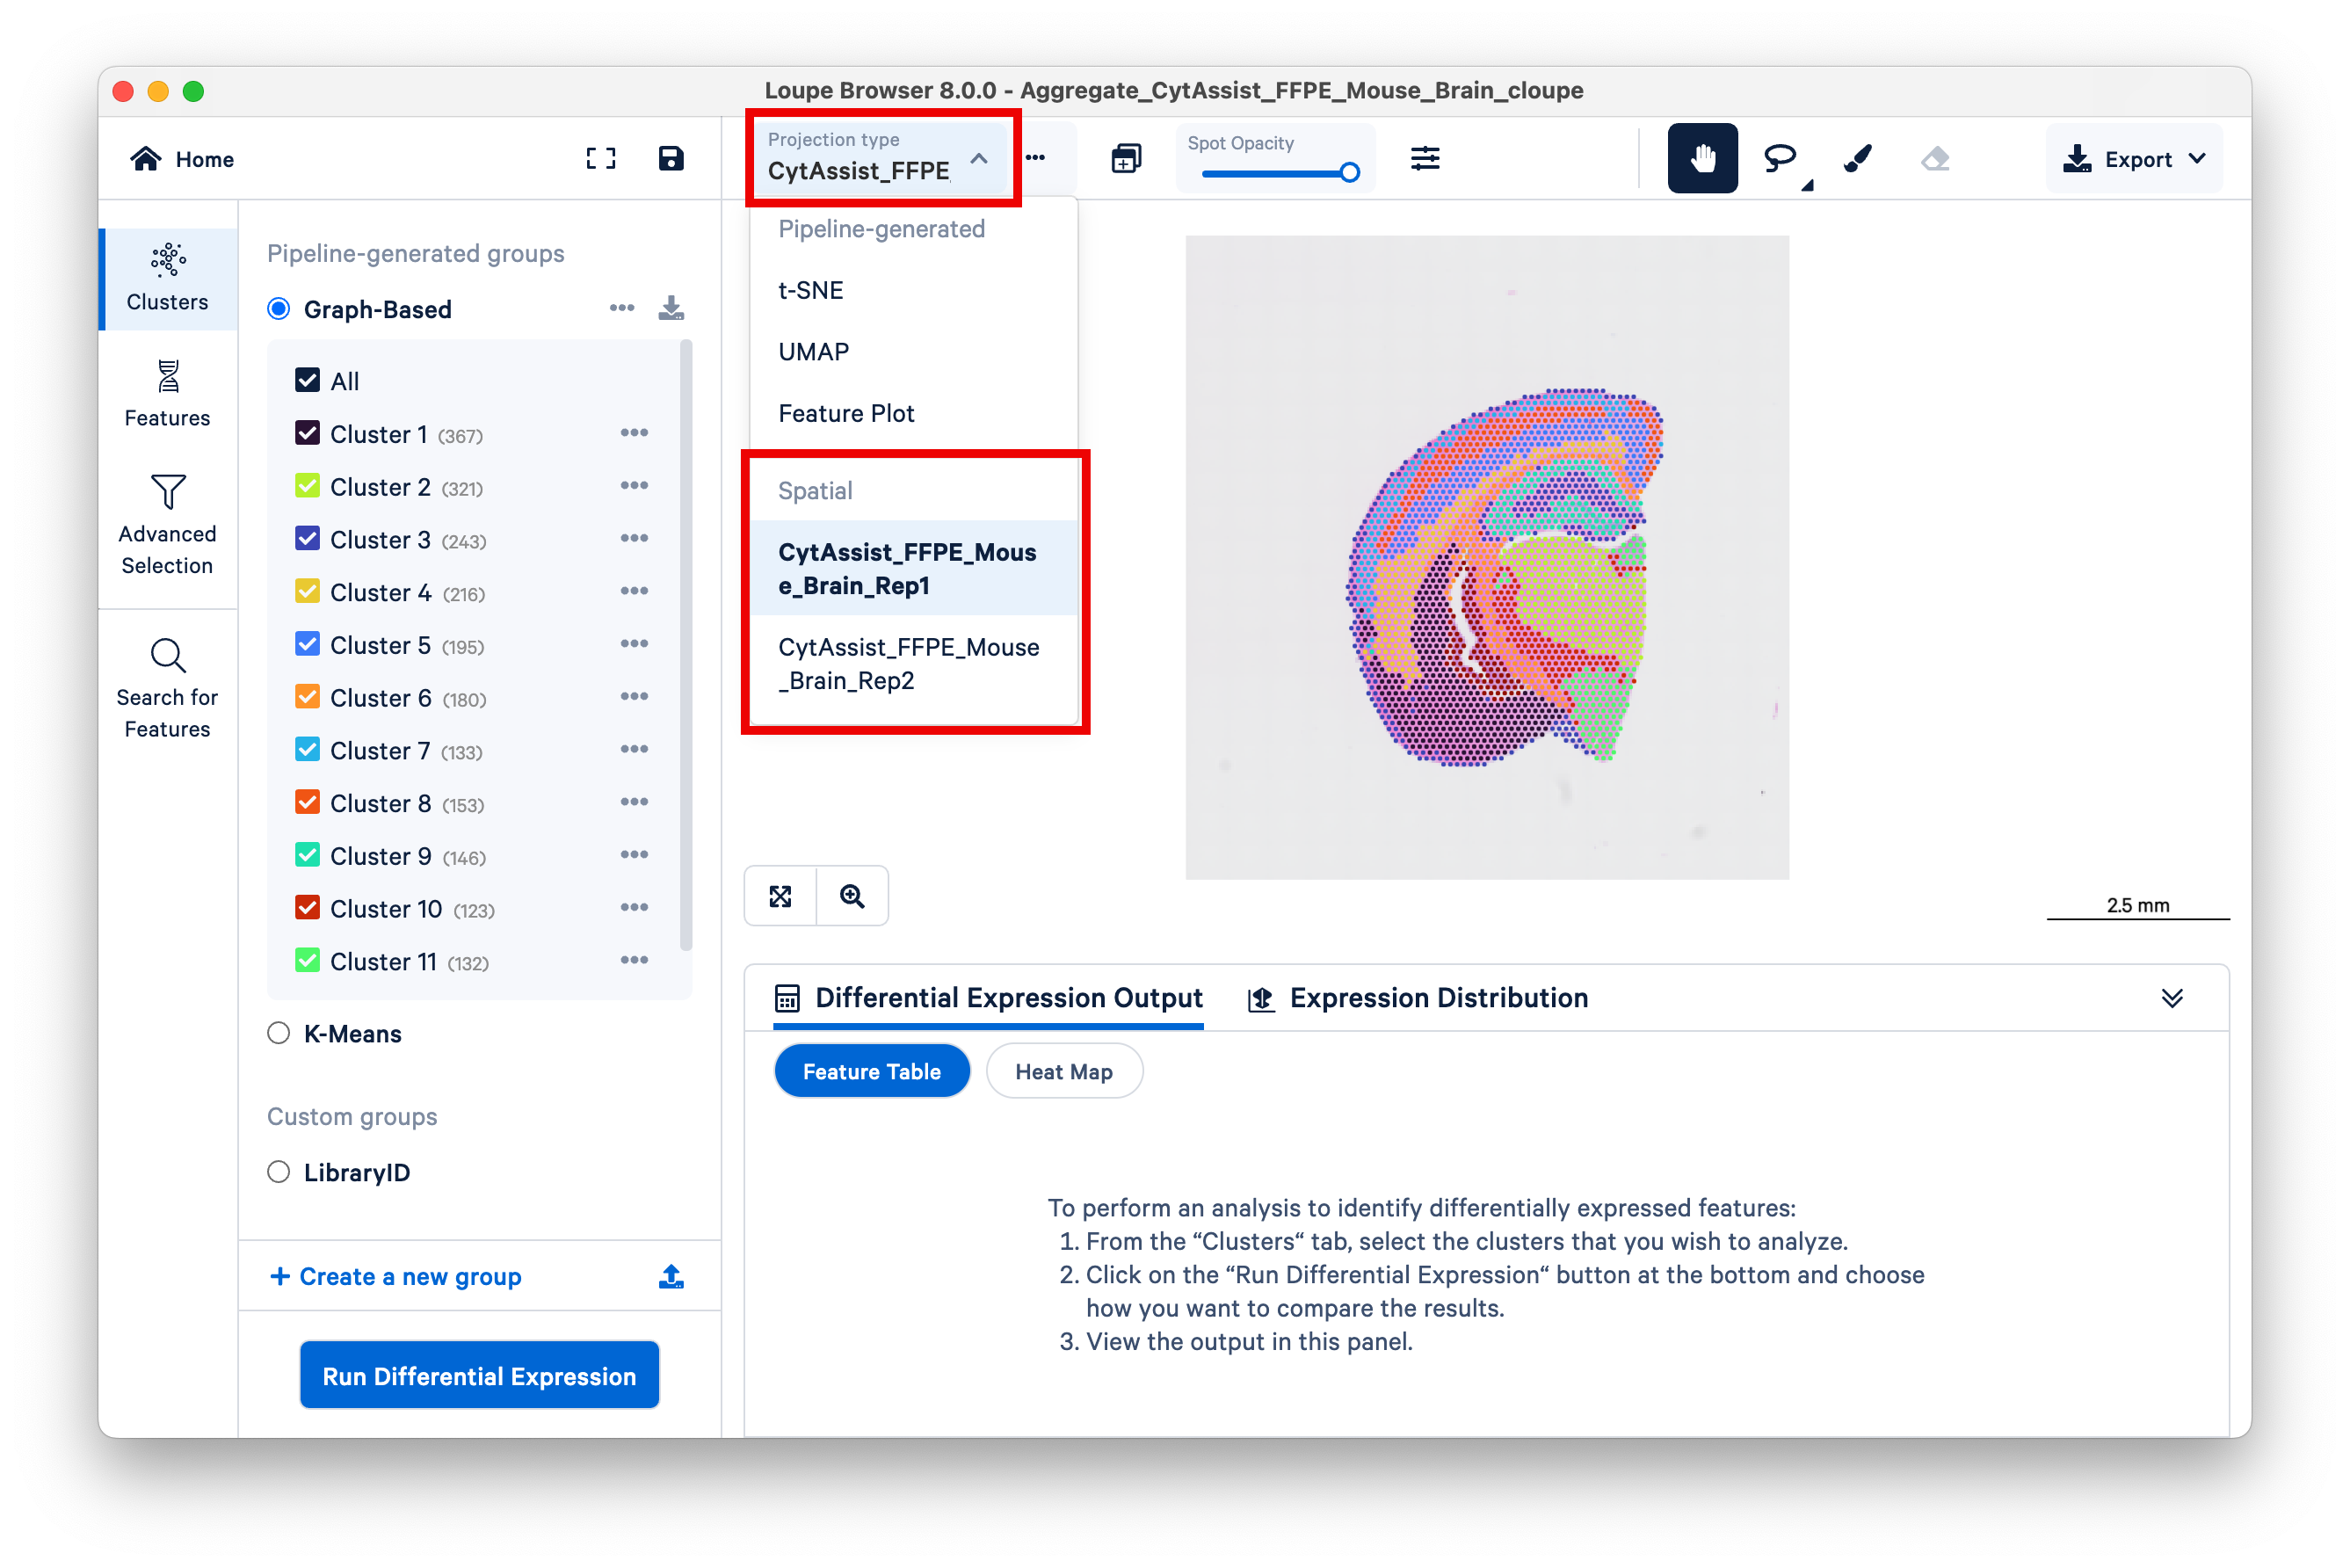
This dataset represents two serial sections from the same mouse brain that were processed as two separate Visium libraries then aggregated, as described above. You can switch between the two replicate samples using the Projection type dropdown menu.
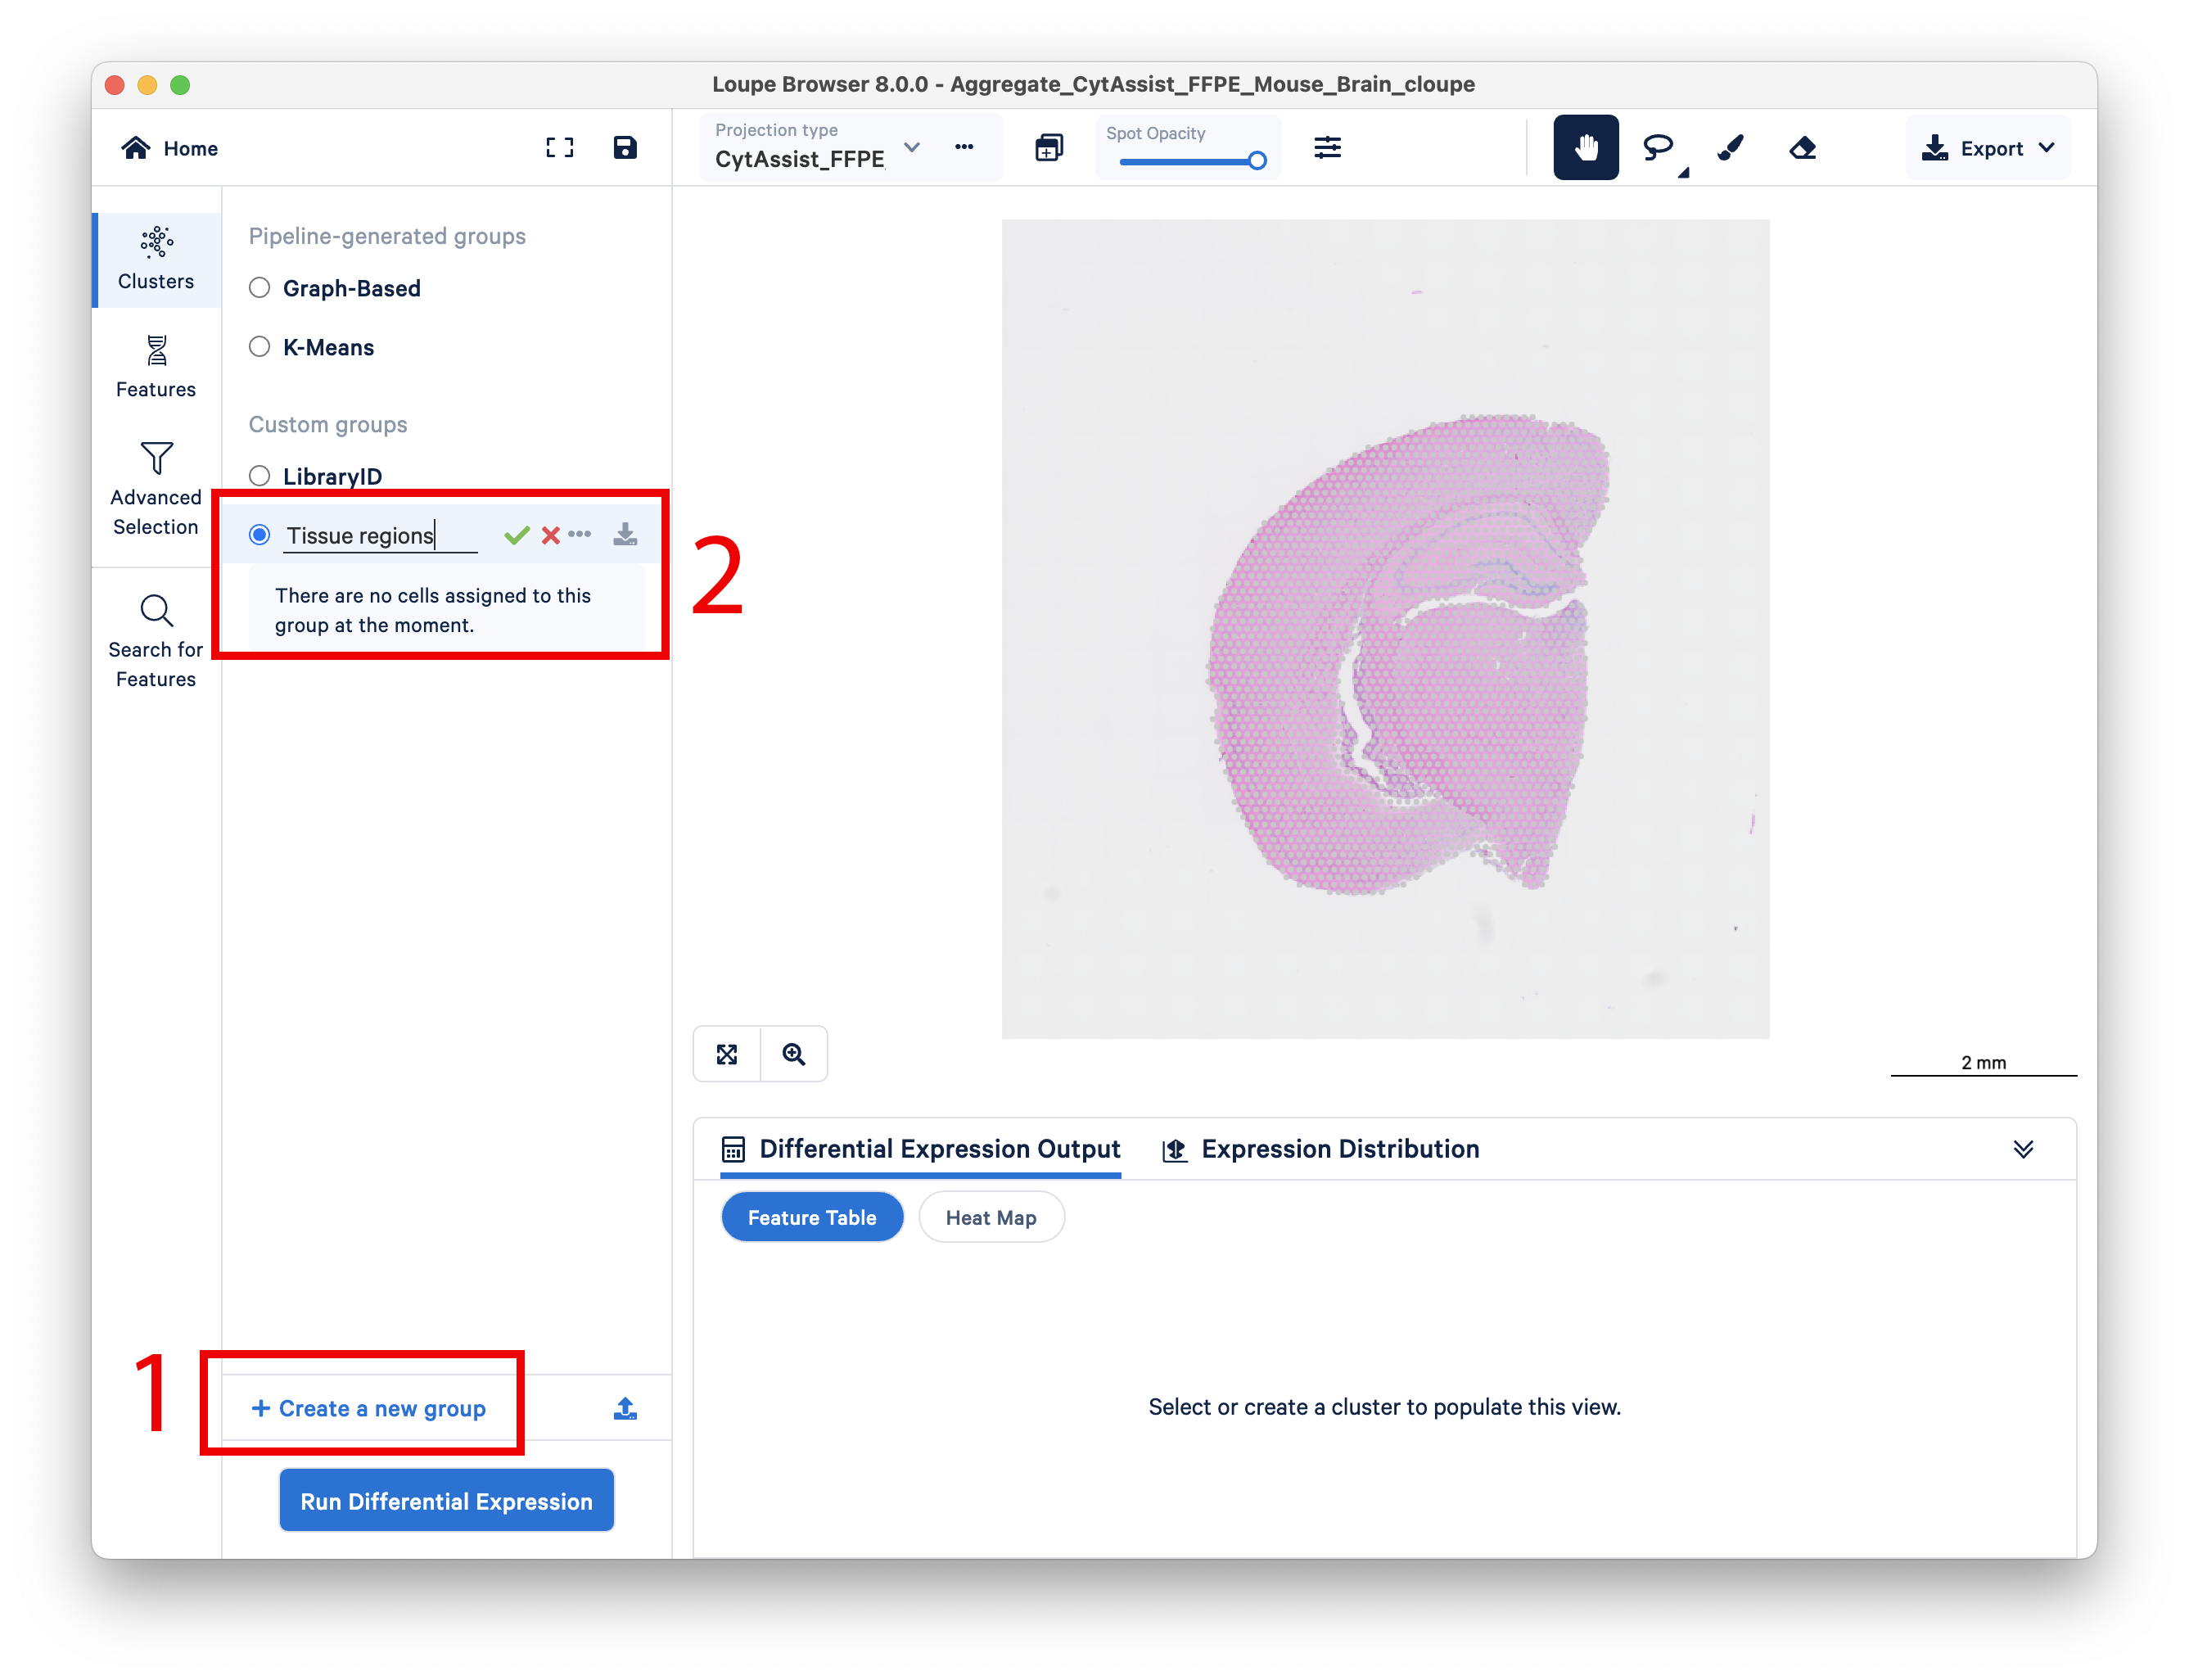
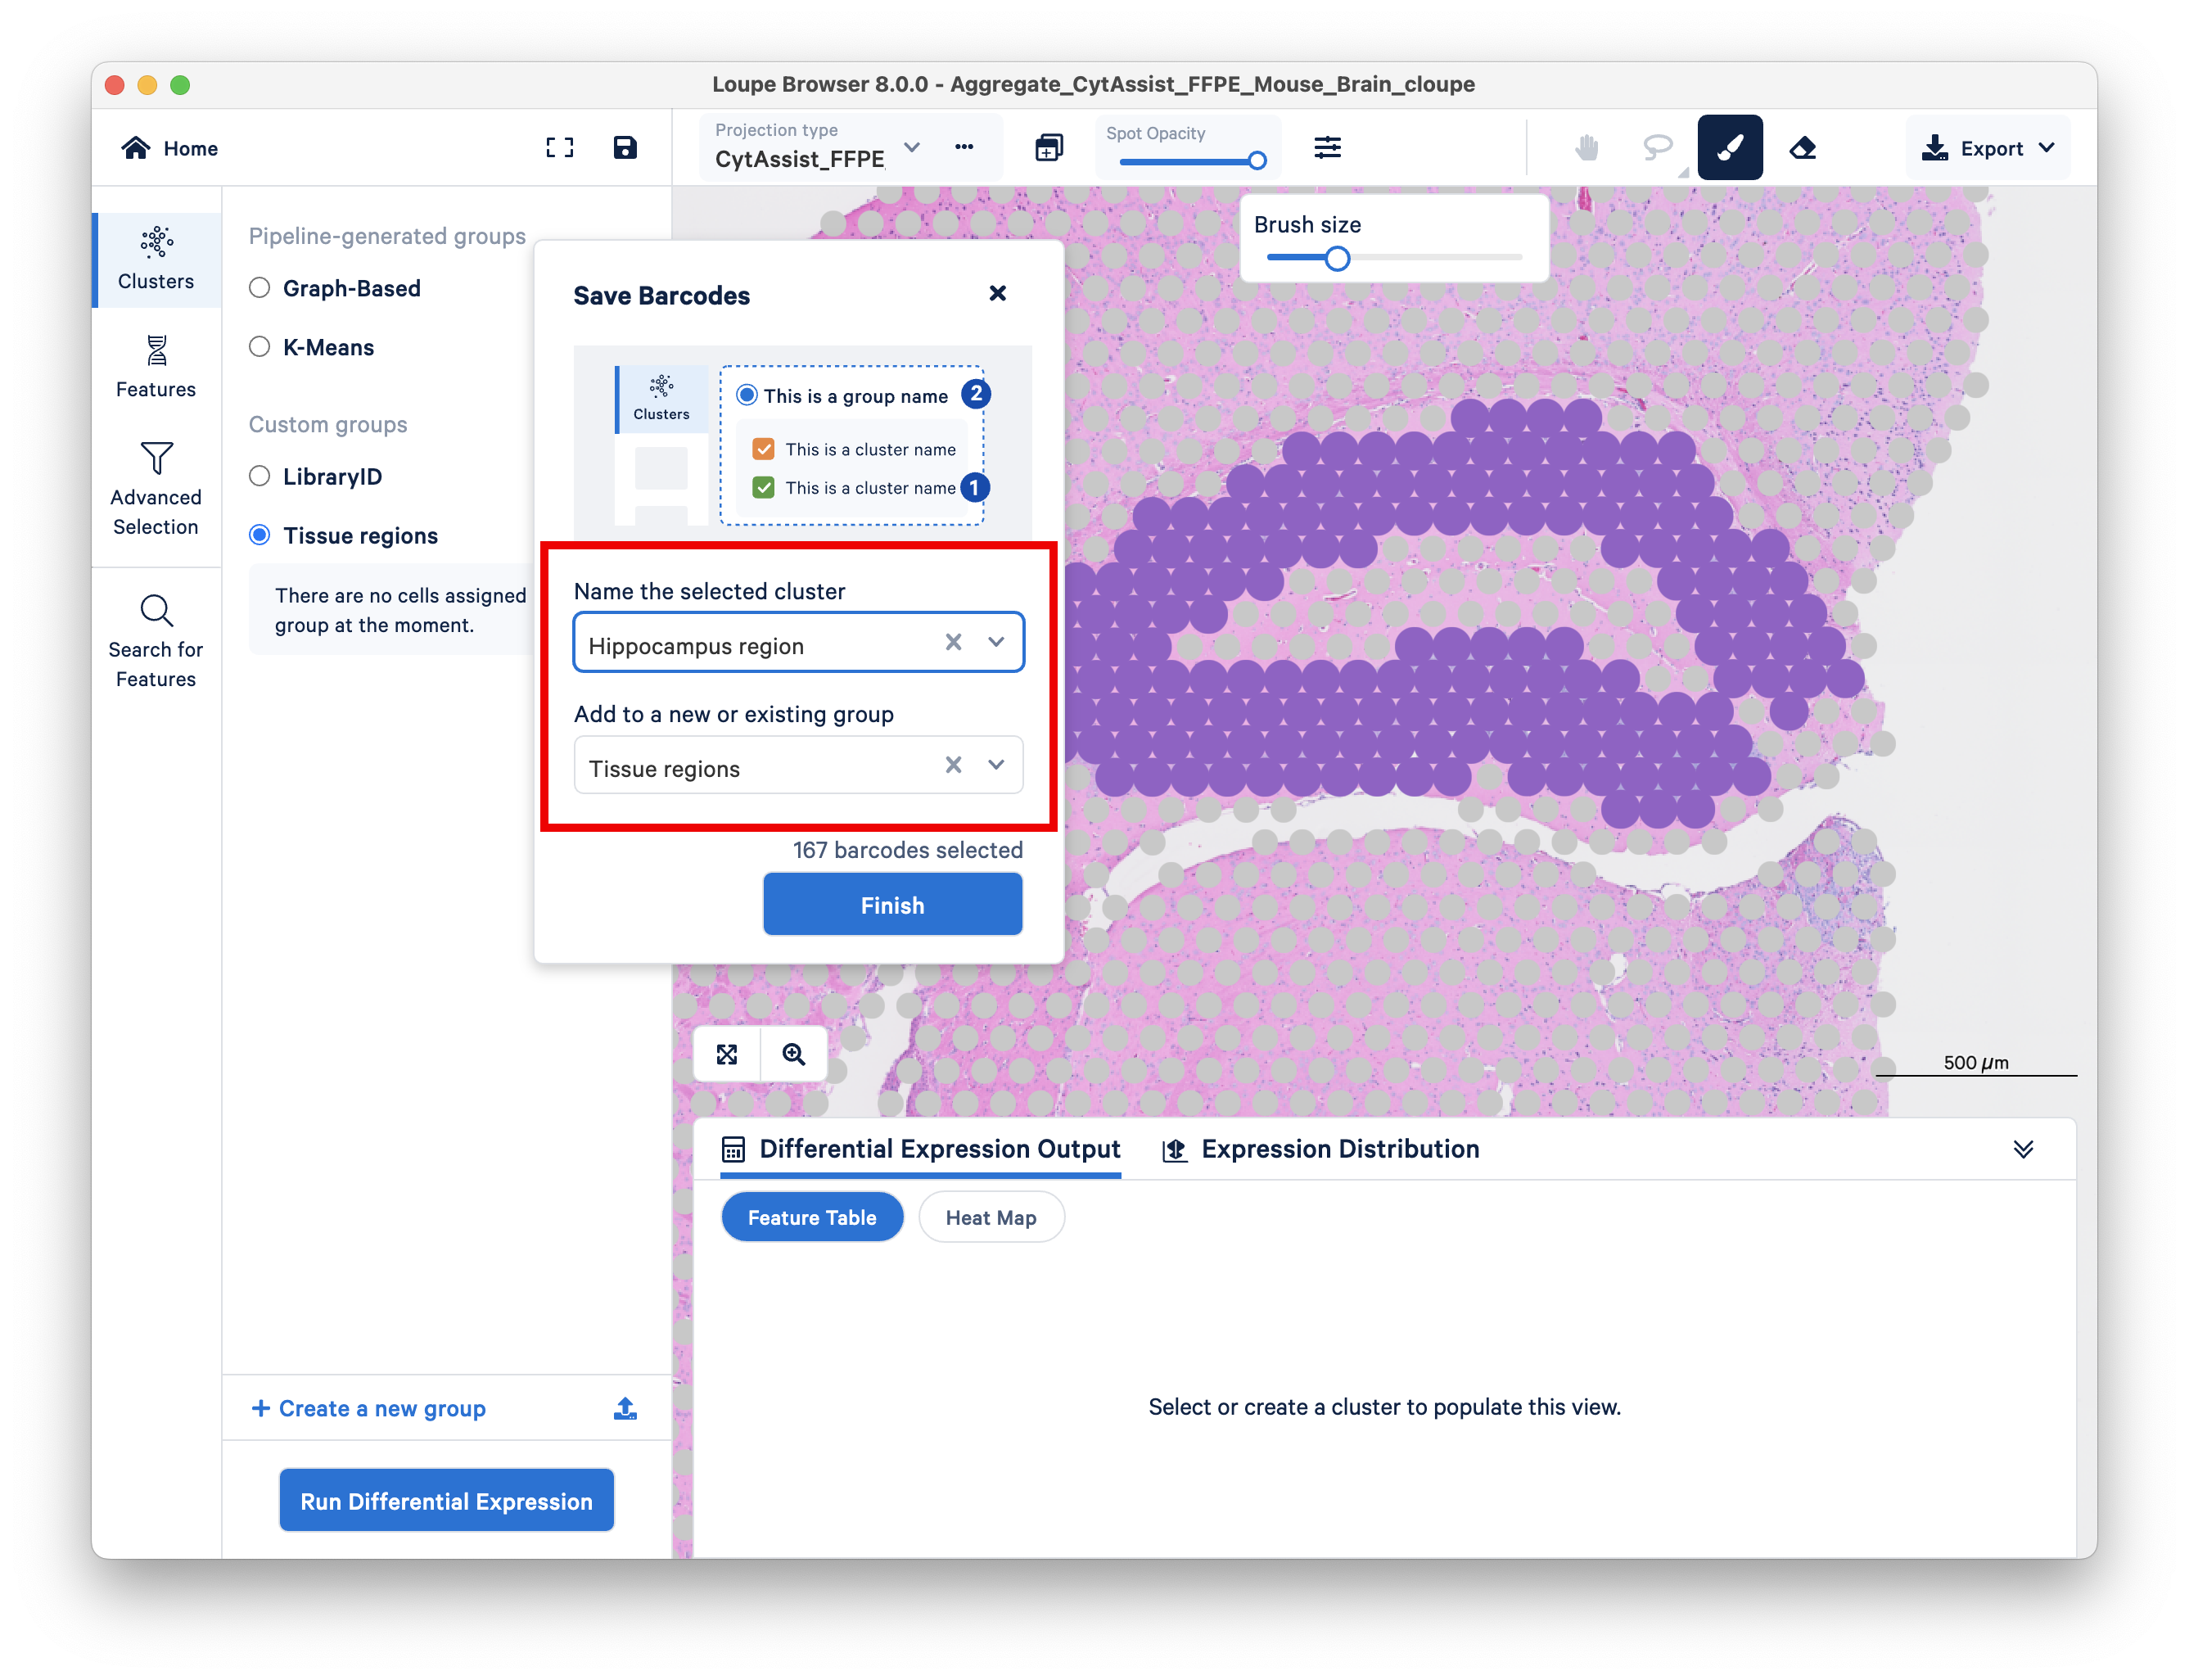
First, create a new group, then name it Tissue regions.
For more precision, adjust your brush size to smaller than the default. Use the eraser tool if necessary.
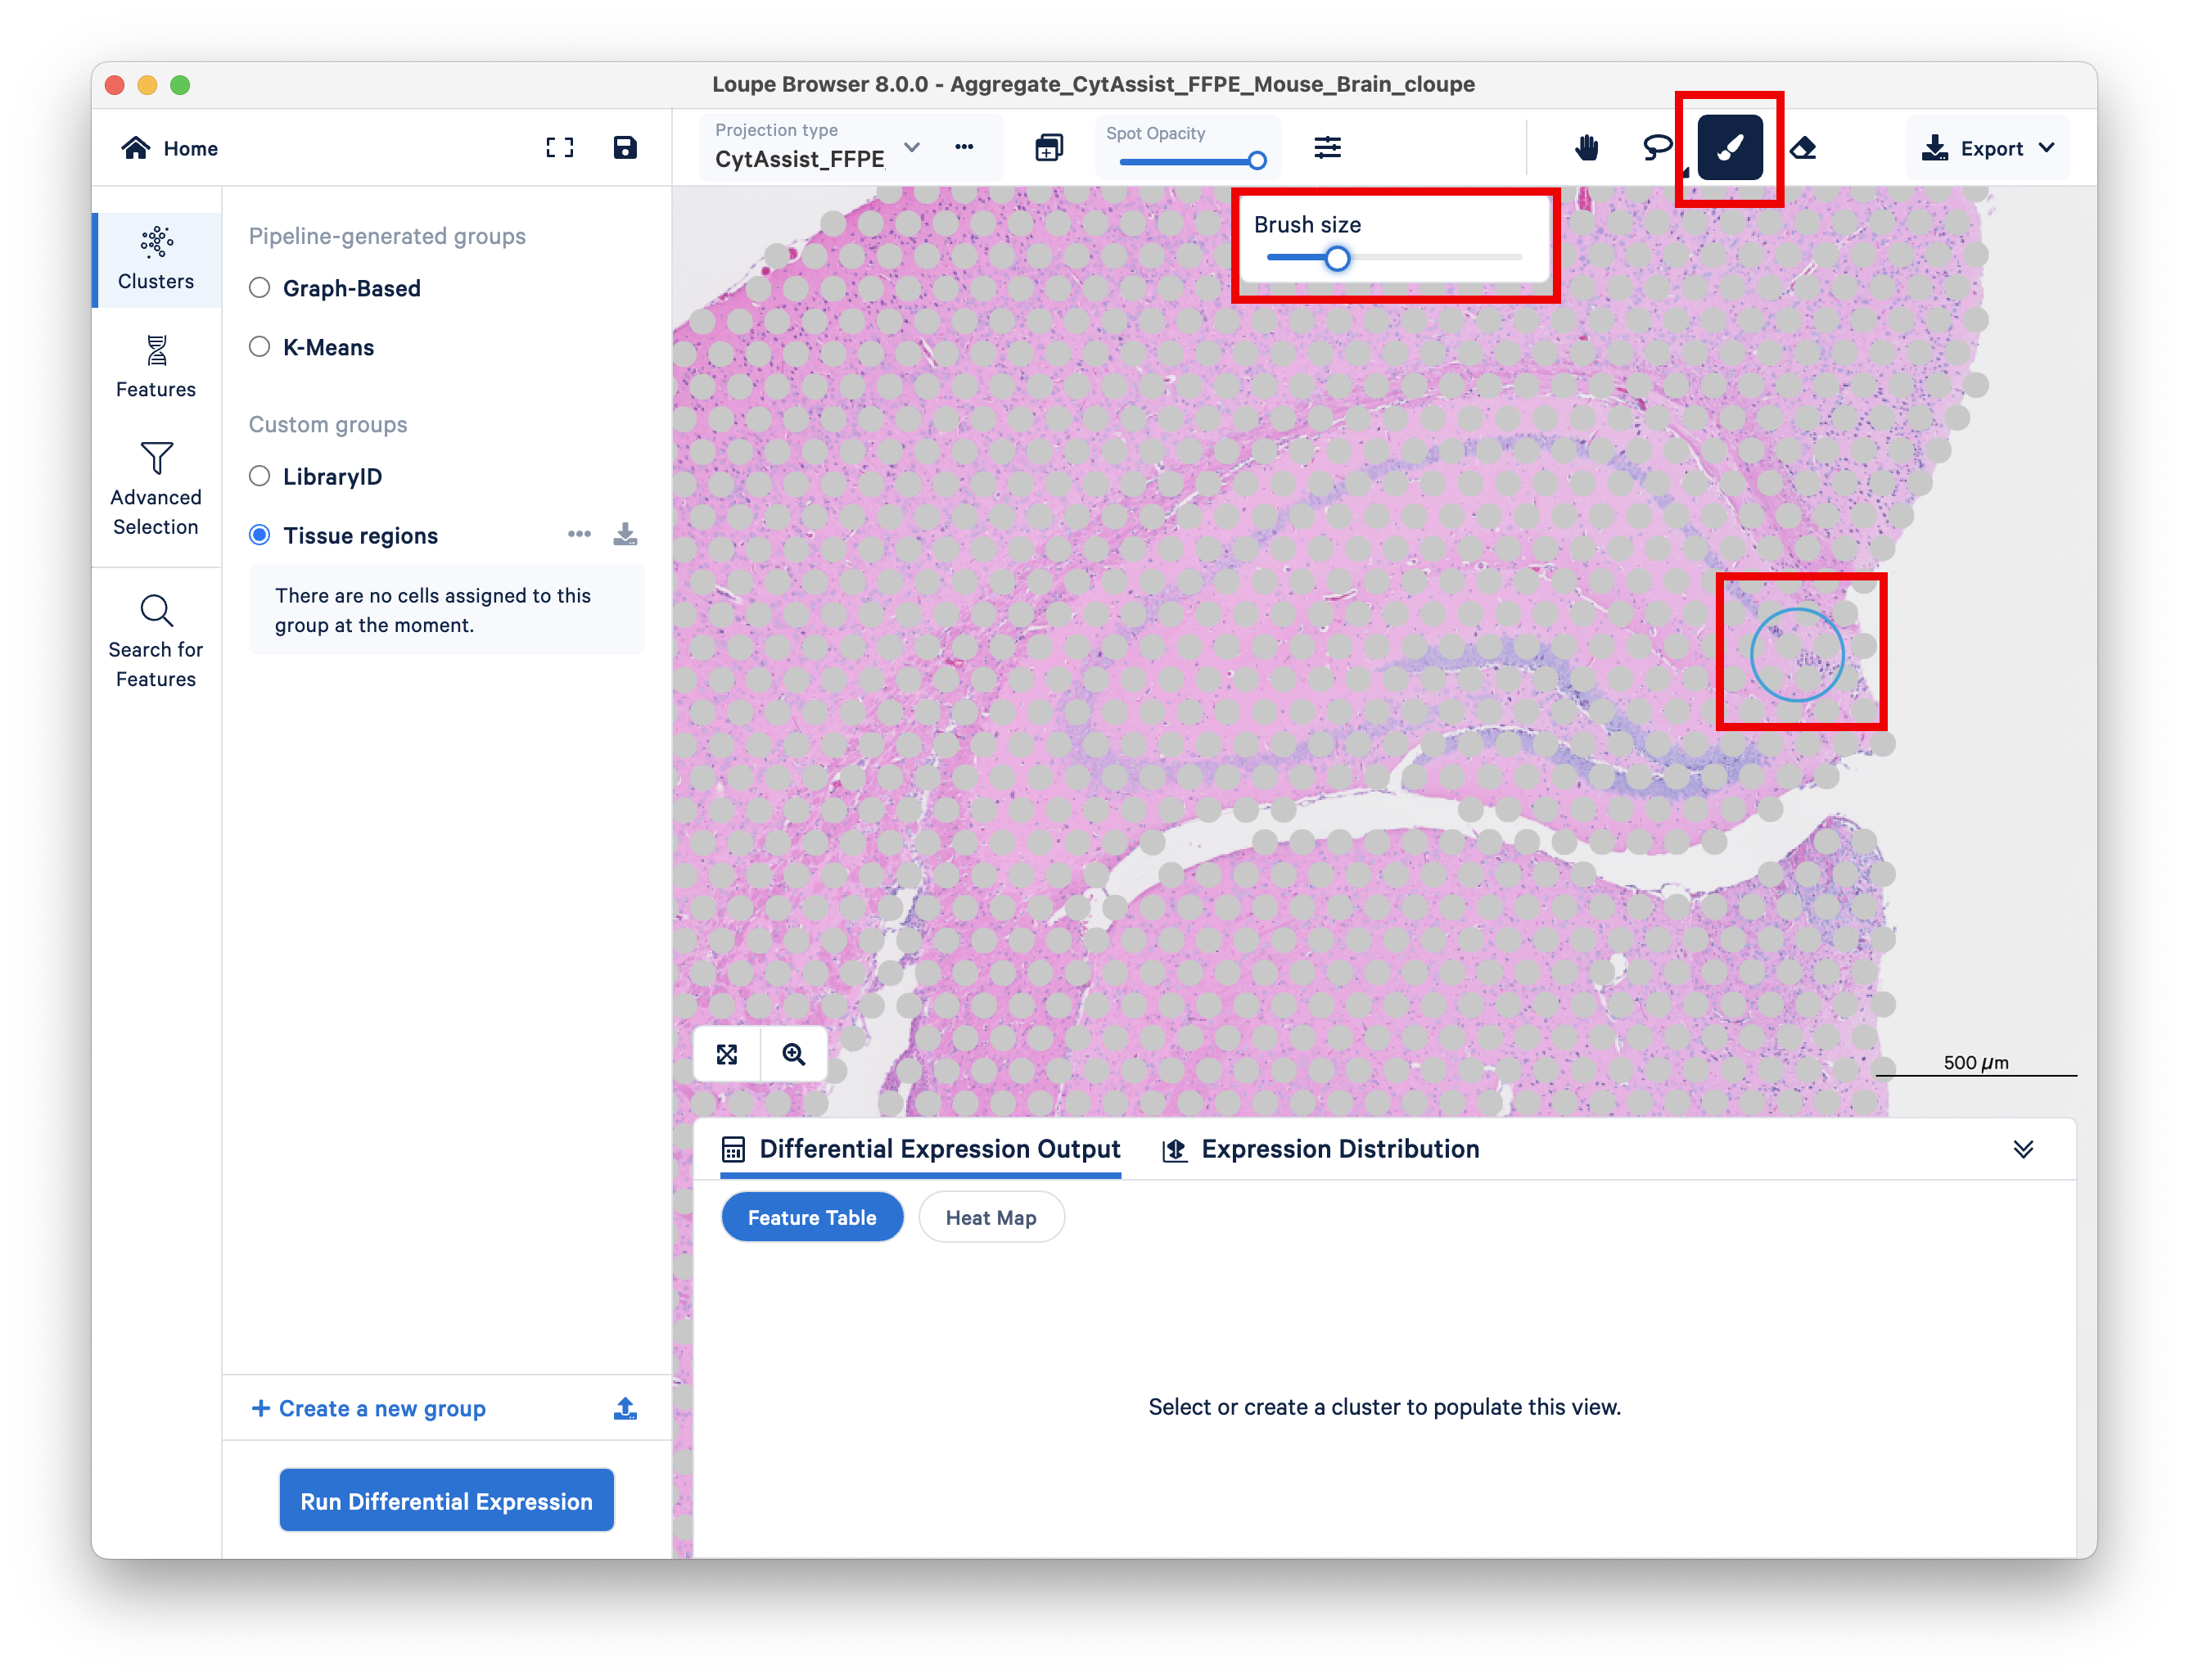
As an example for this tutorial, we select the region around the hippocampus, which is a prominent morphological feature of the mouse brain. Name the new cluster Hippocampus regions within the group Tissue regions.
Next, do the same for the second replicate.
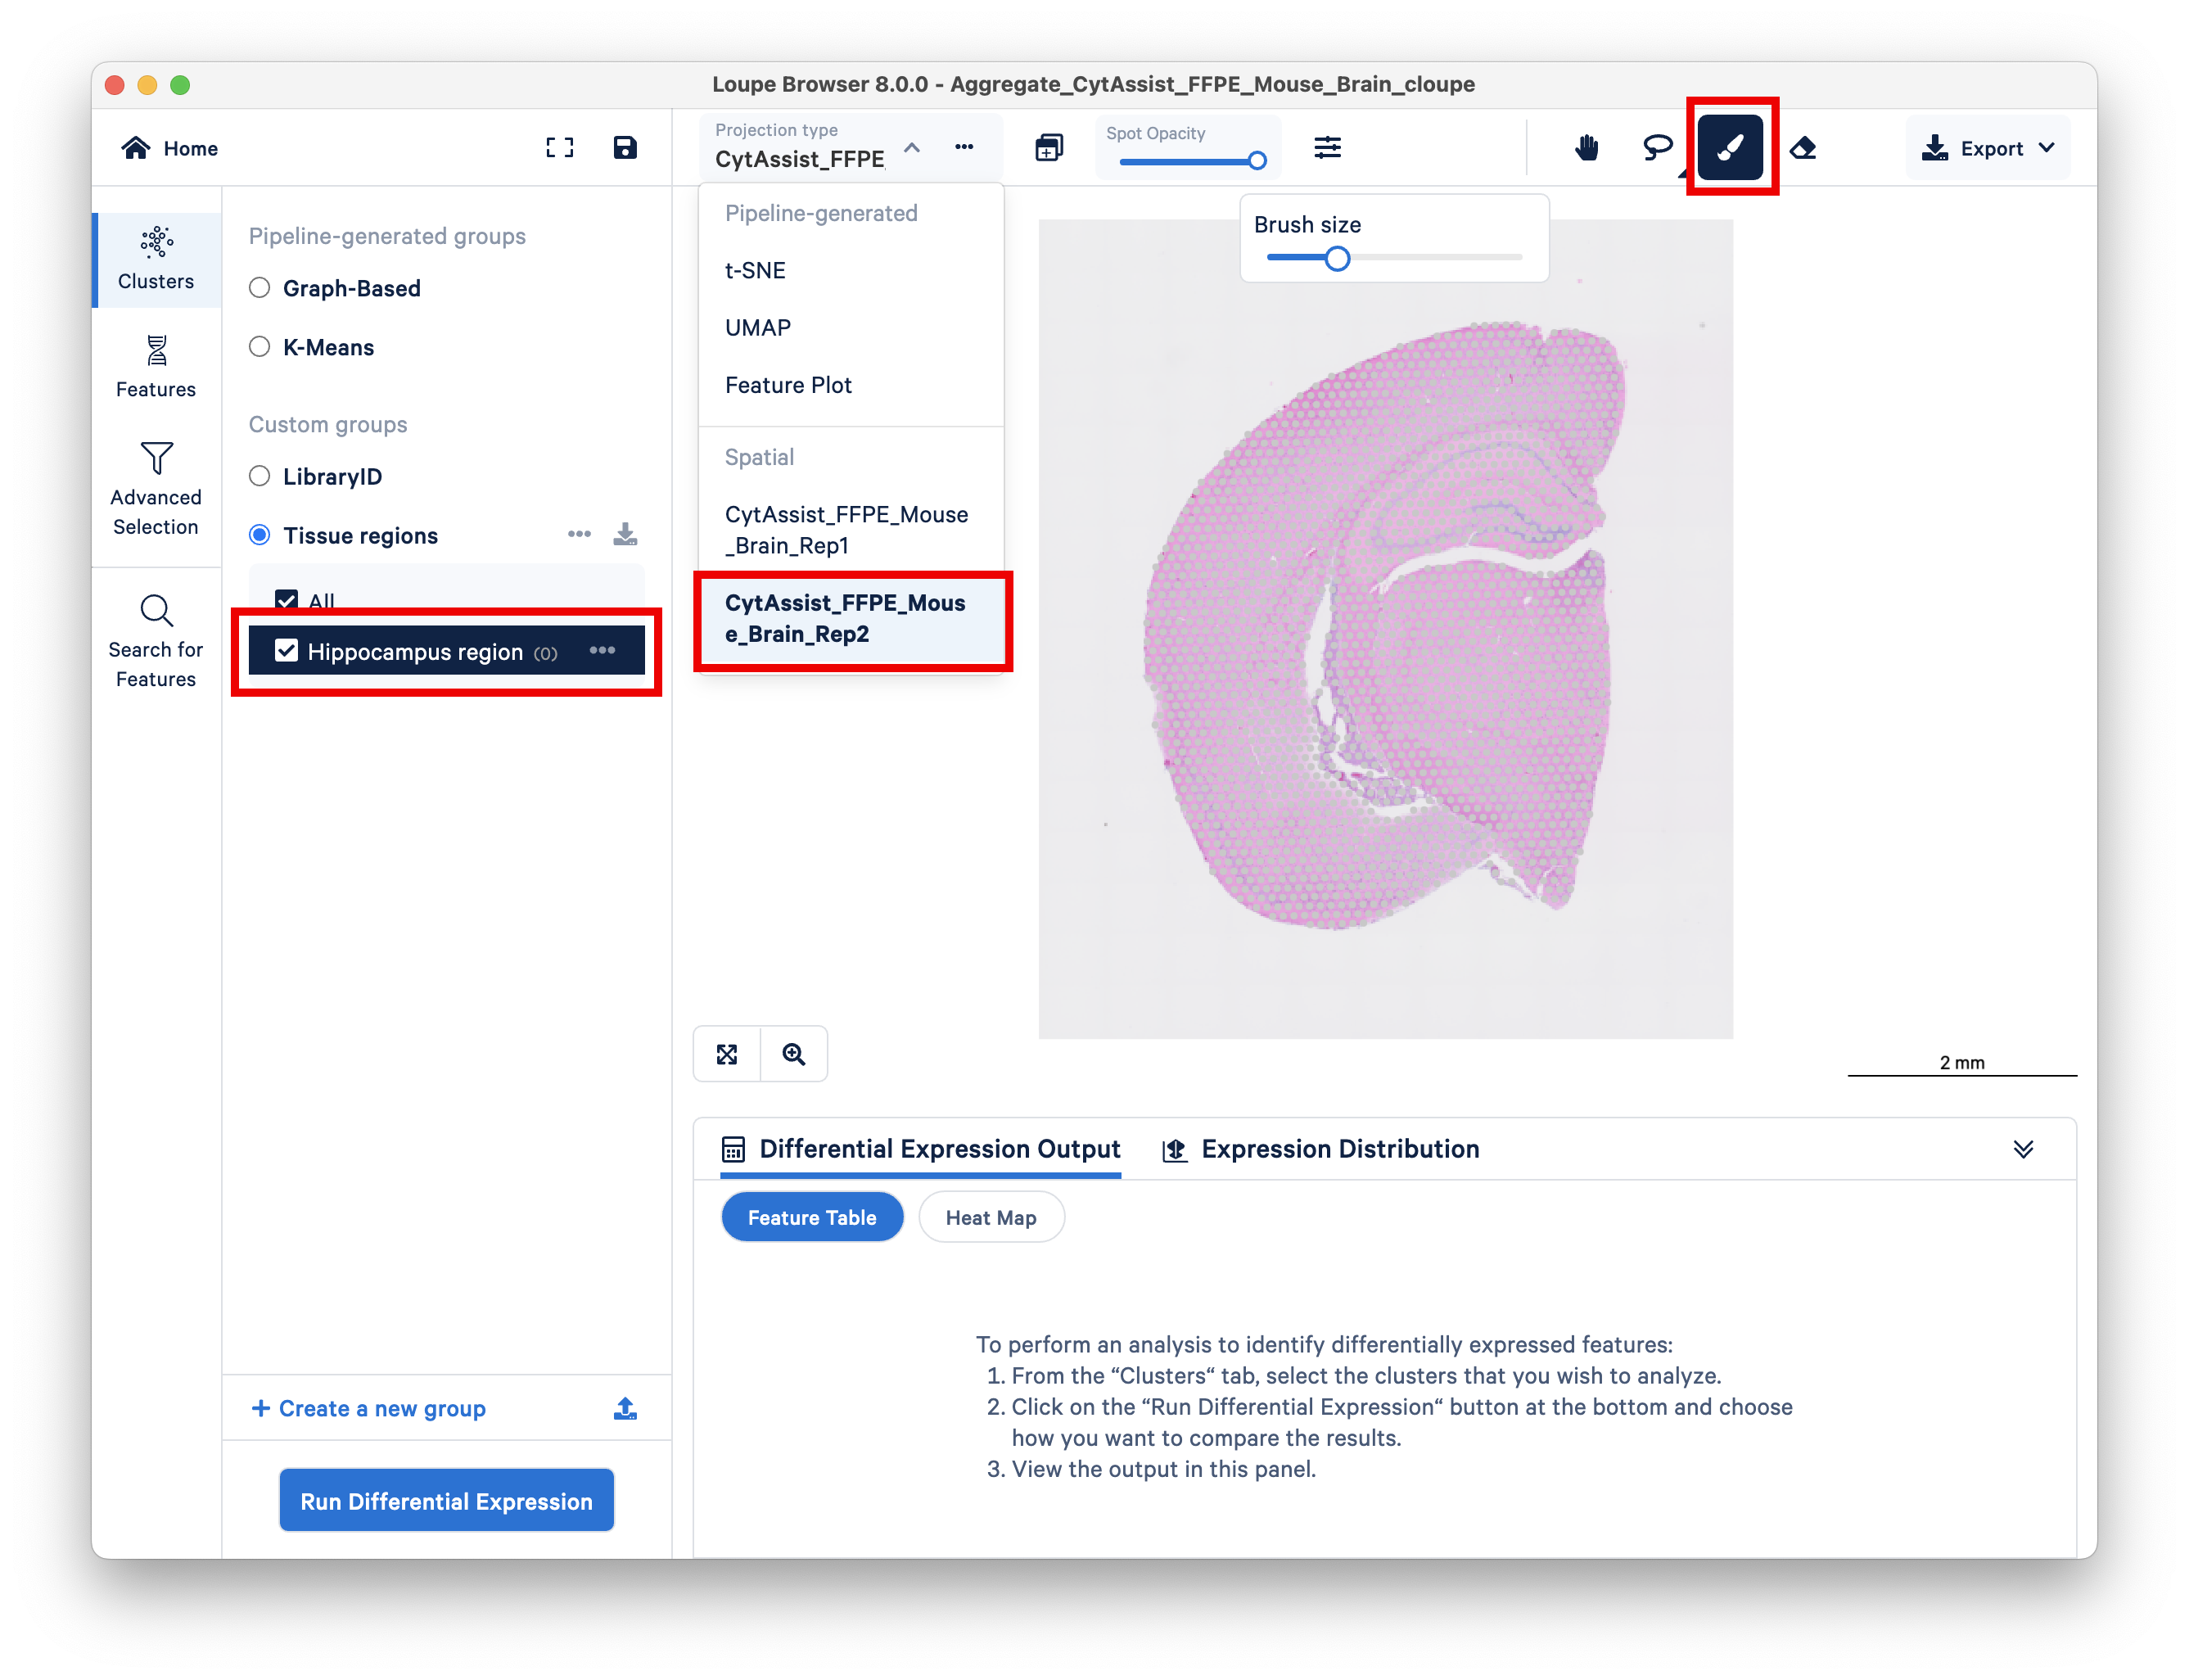
It is important that selected regions from each sample get added to the same group and cluster.
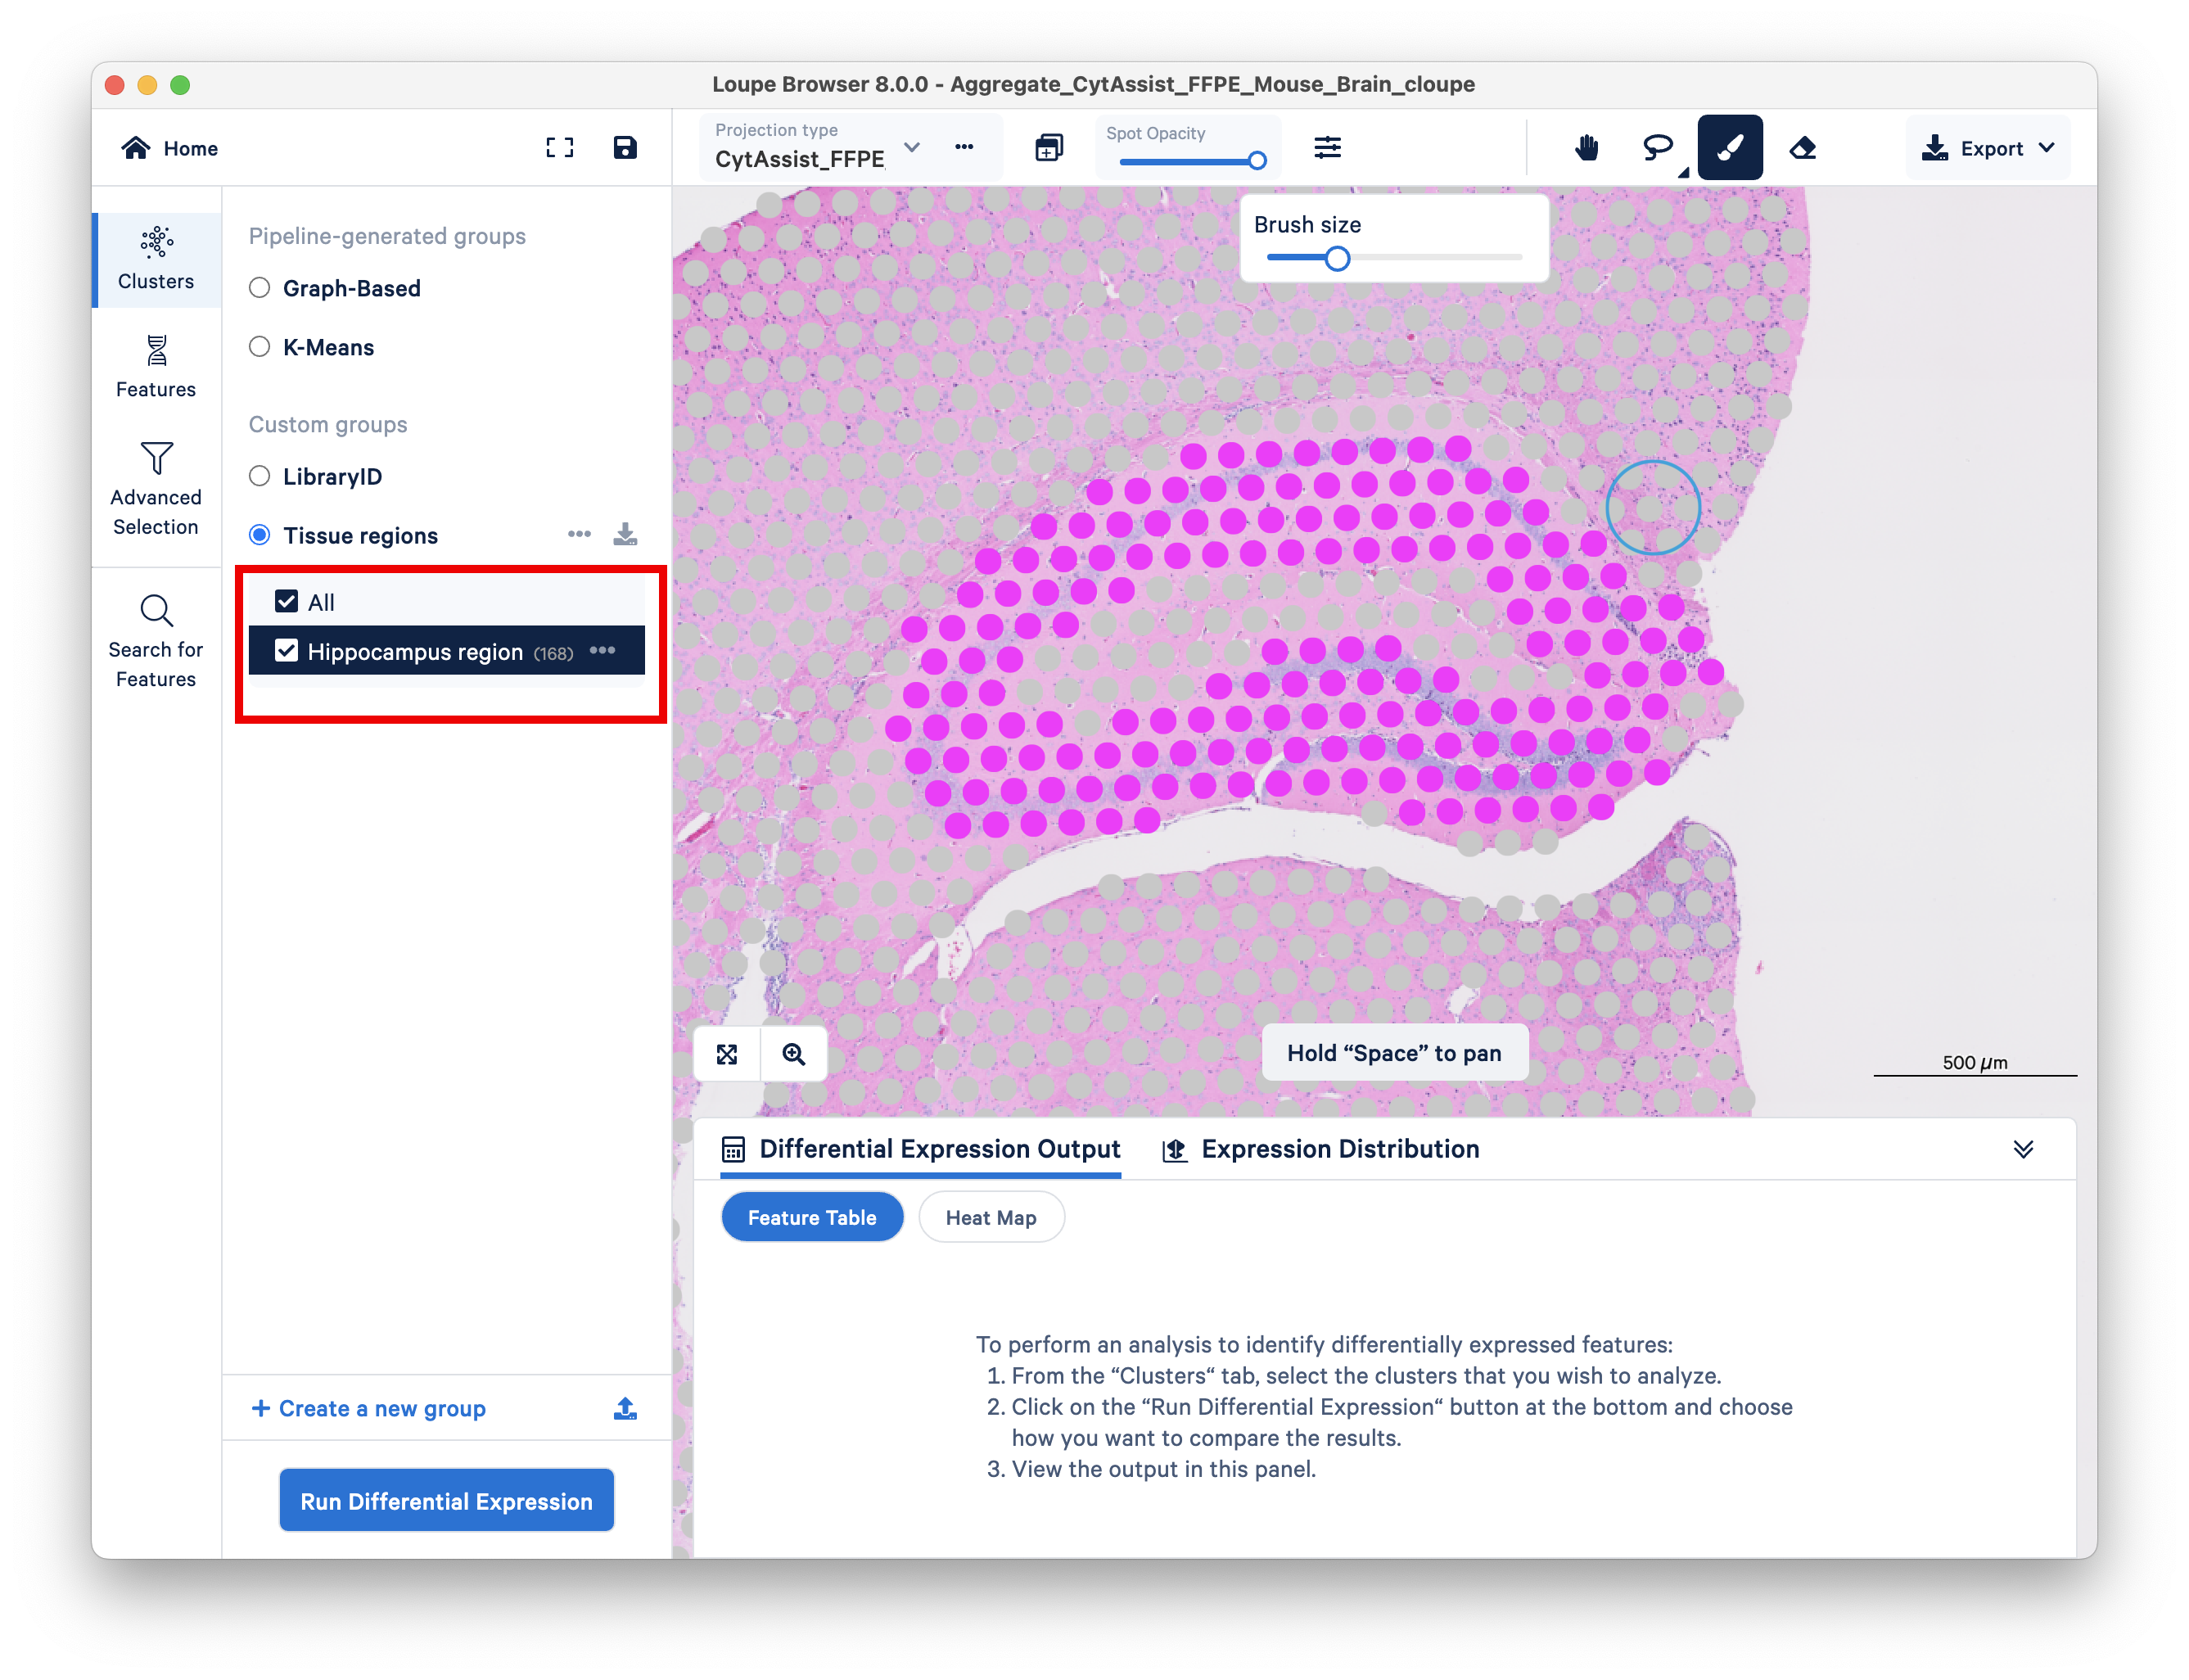
If you did this step correctly, you should see the same group and cluster on the left as you toggle between the two replicates using the Projection type dropdown. Unless you selected the same number of spots in each replicate, the number of spots reported should change as you toggle.
In order for the multi-sample differential expression analysis to run correctly, we must perform an additional step to define experimental conditions, in this case replicate serial sections from the same mouse brain.
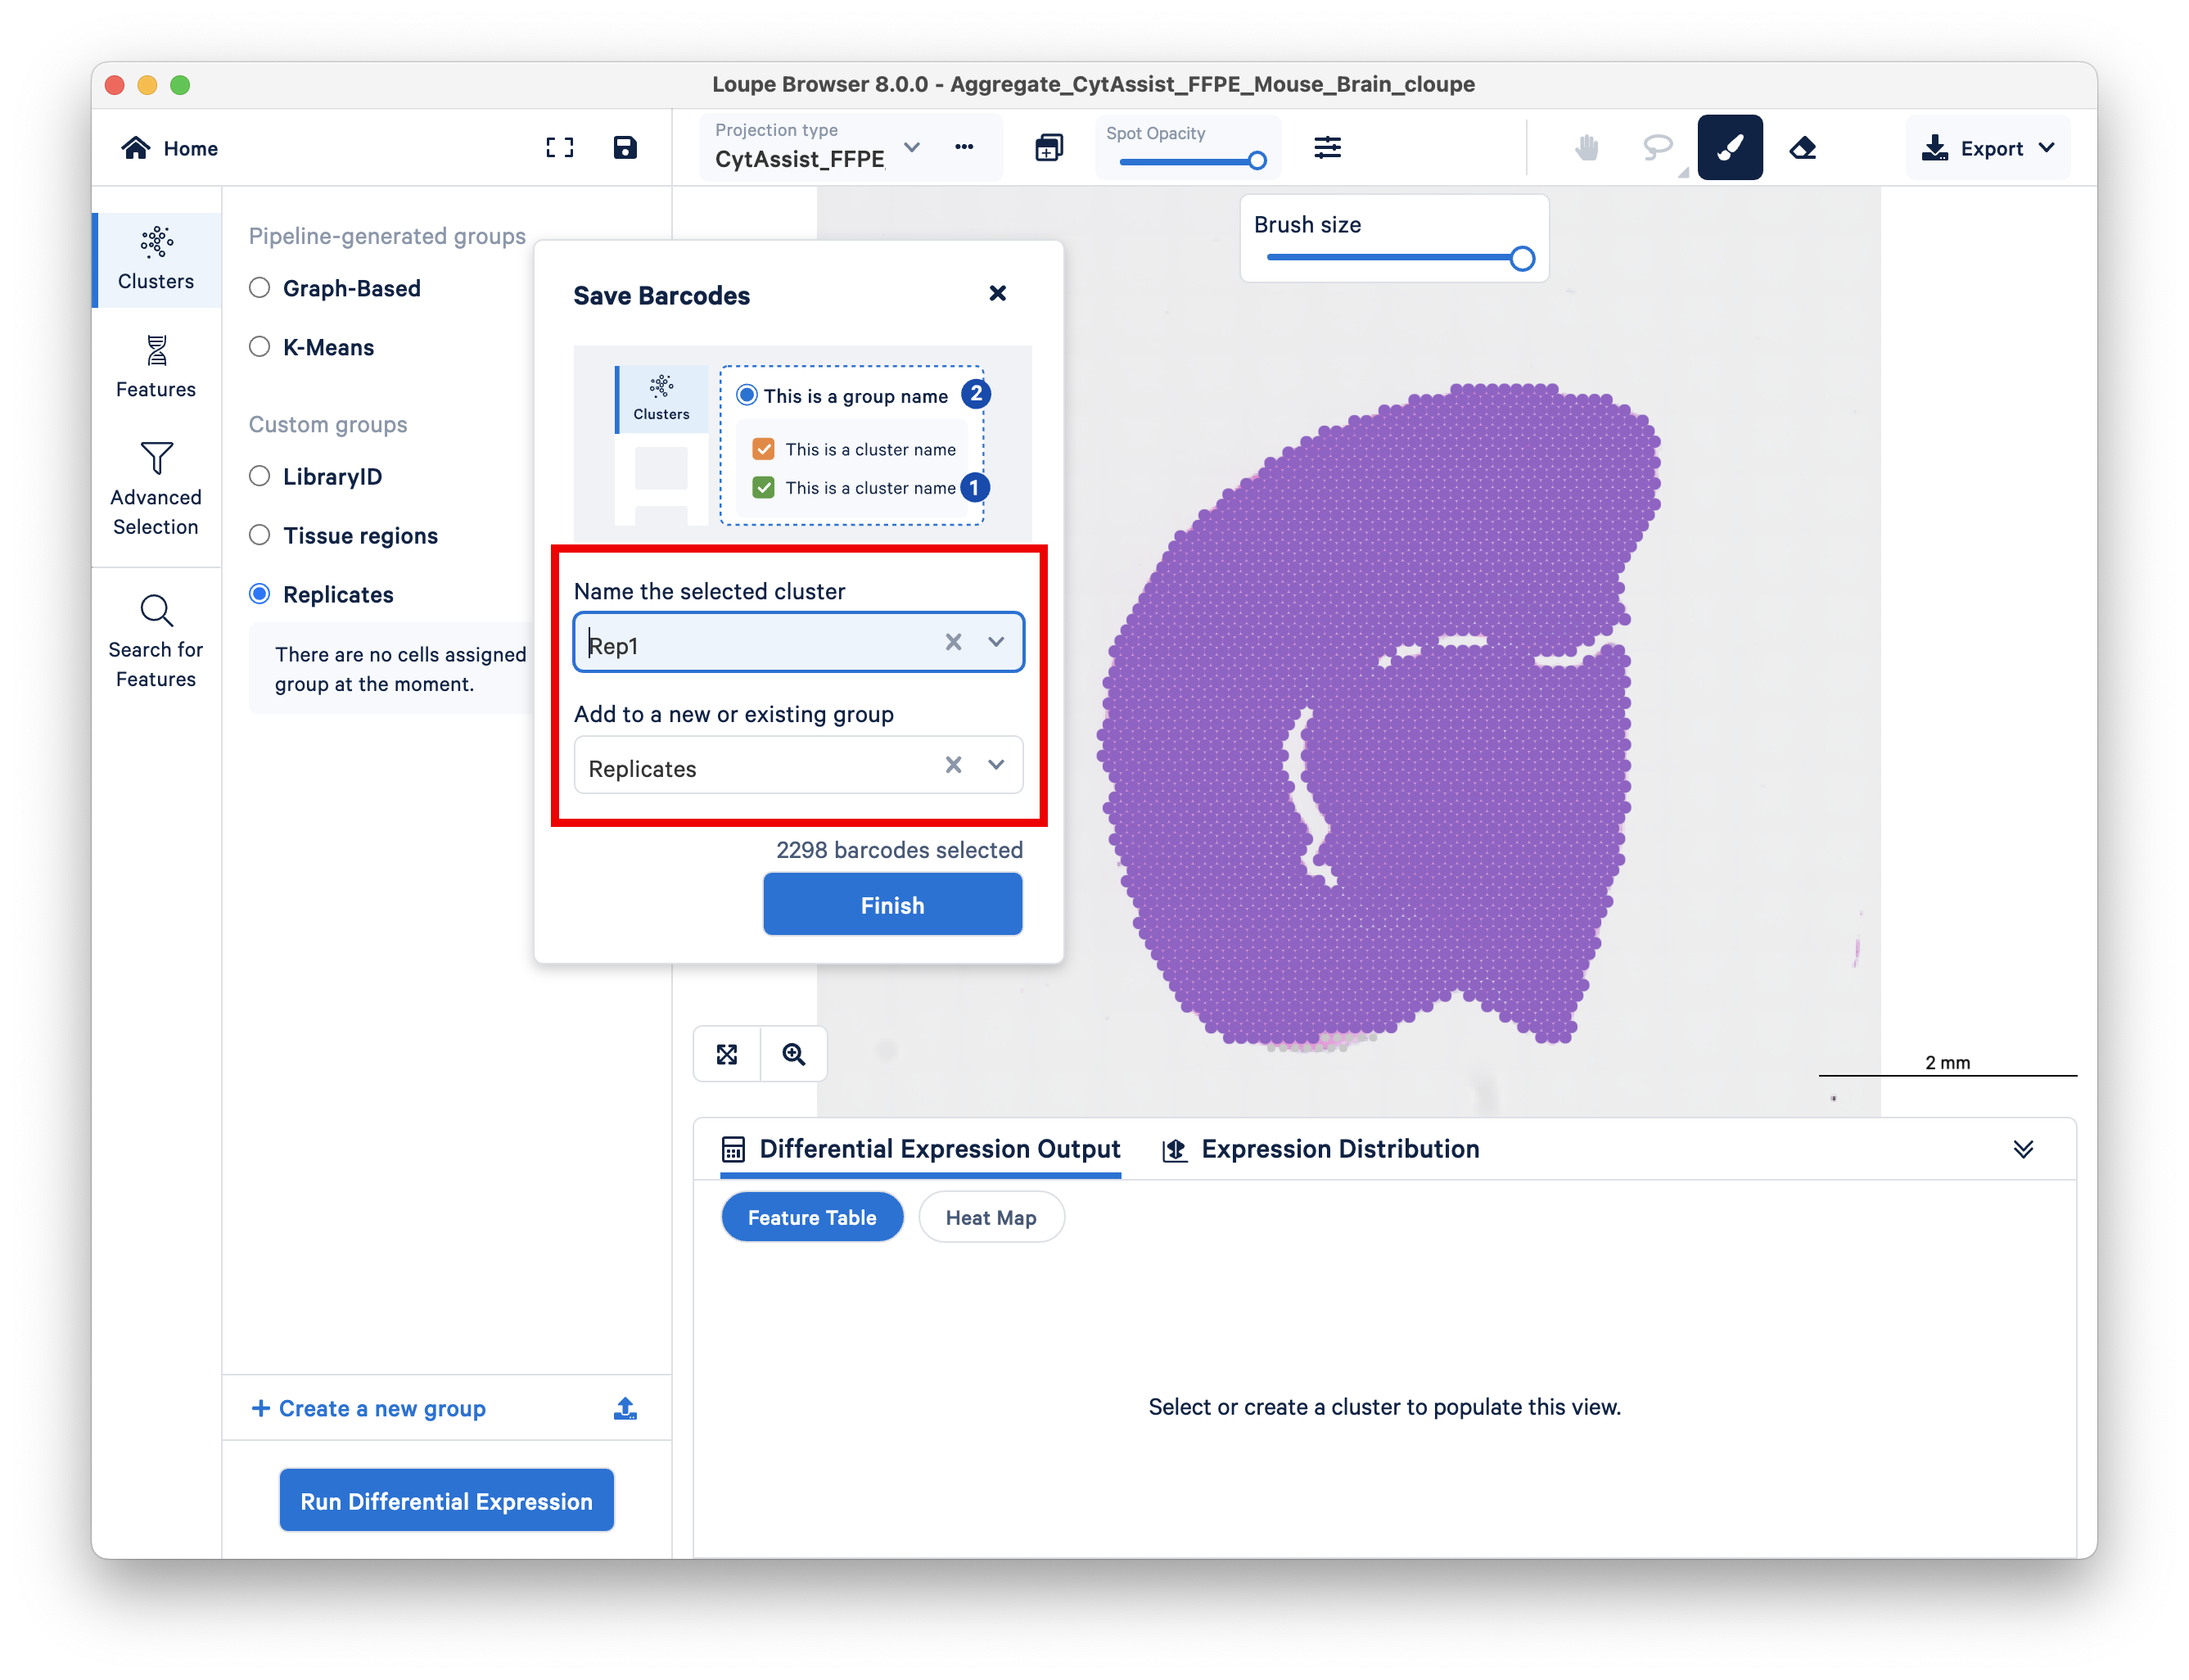
First, switch to the first replicate, and create a new group called Replicates.
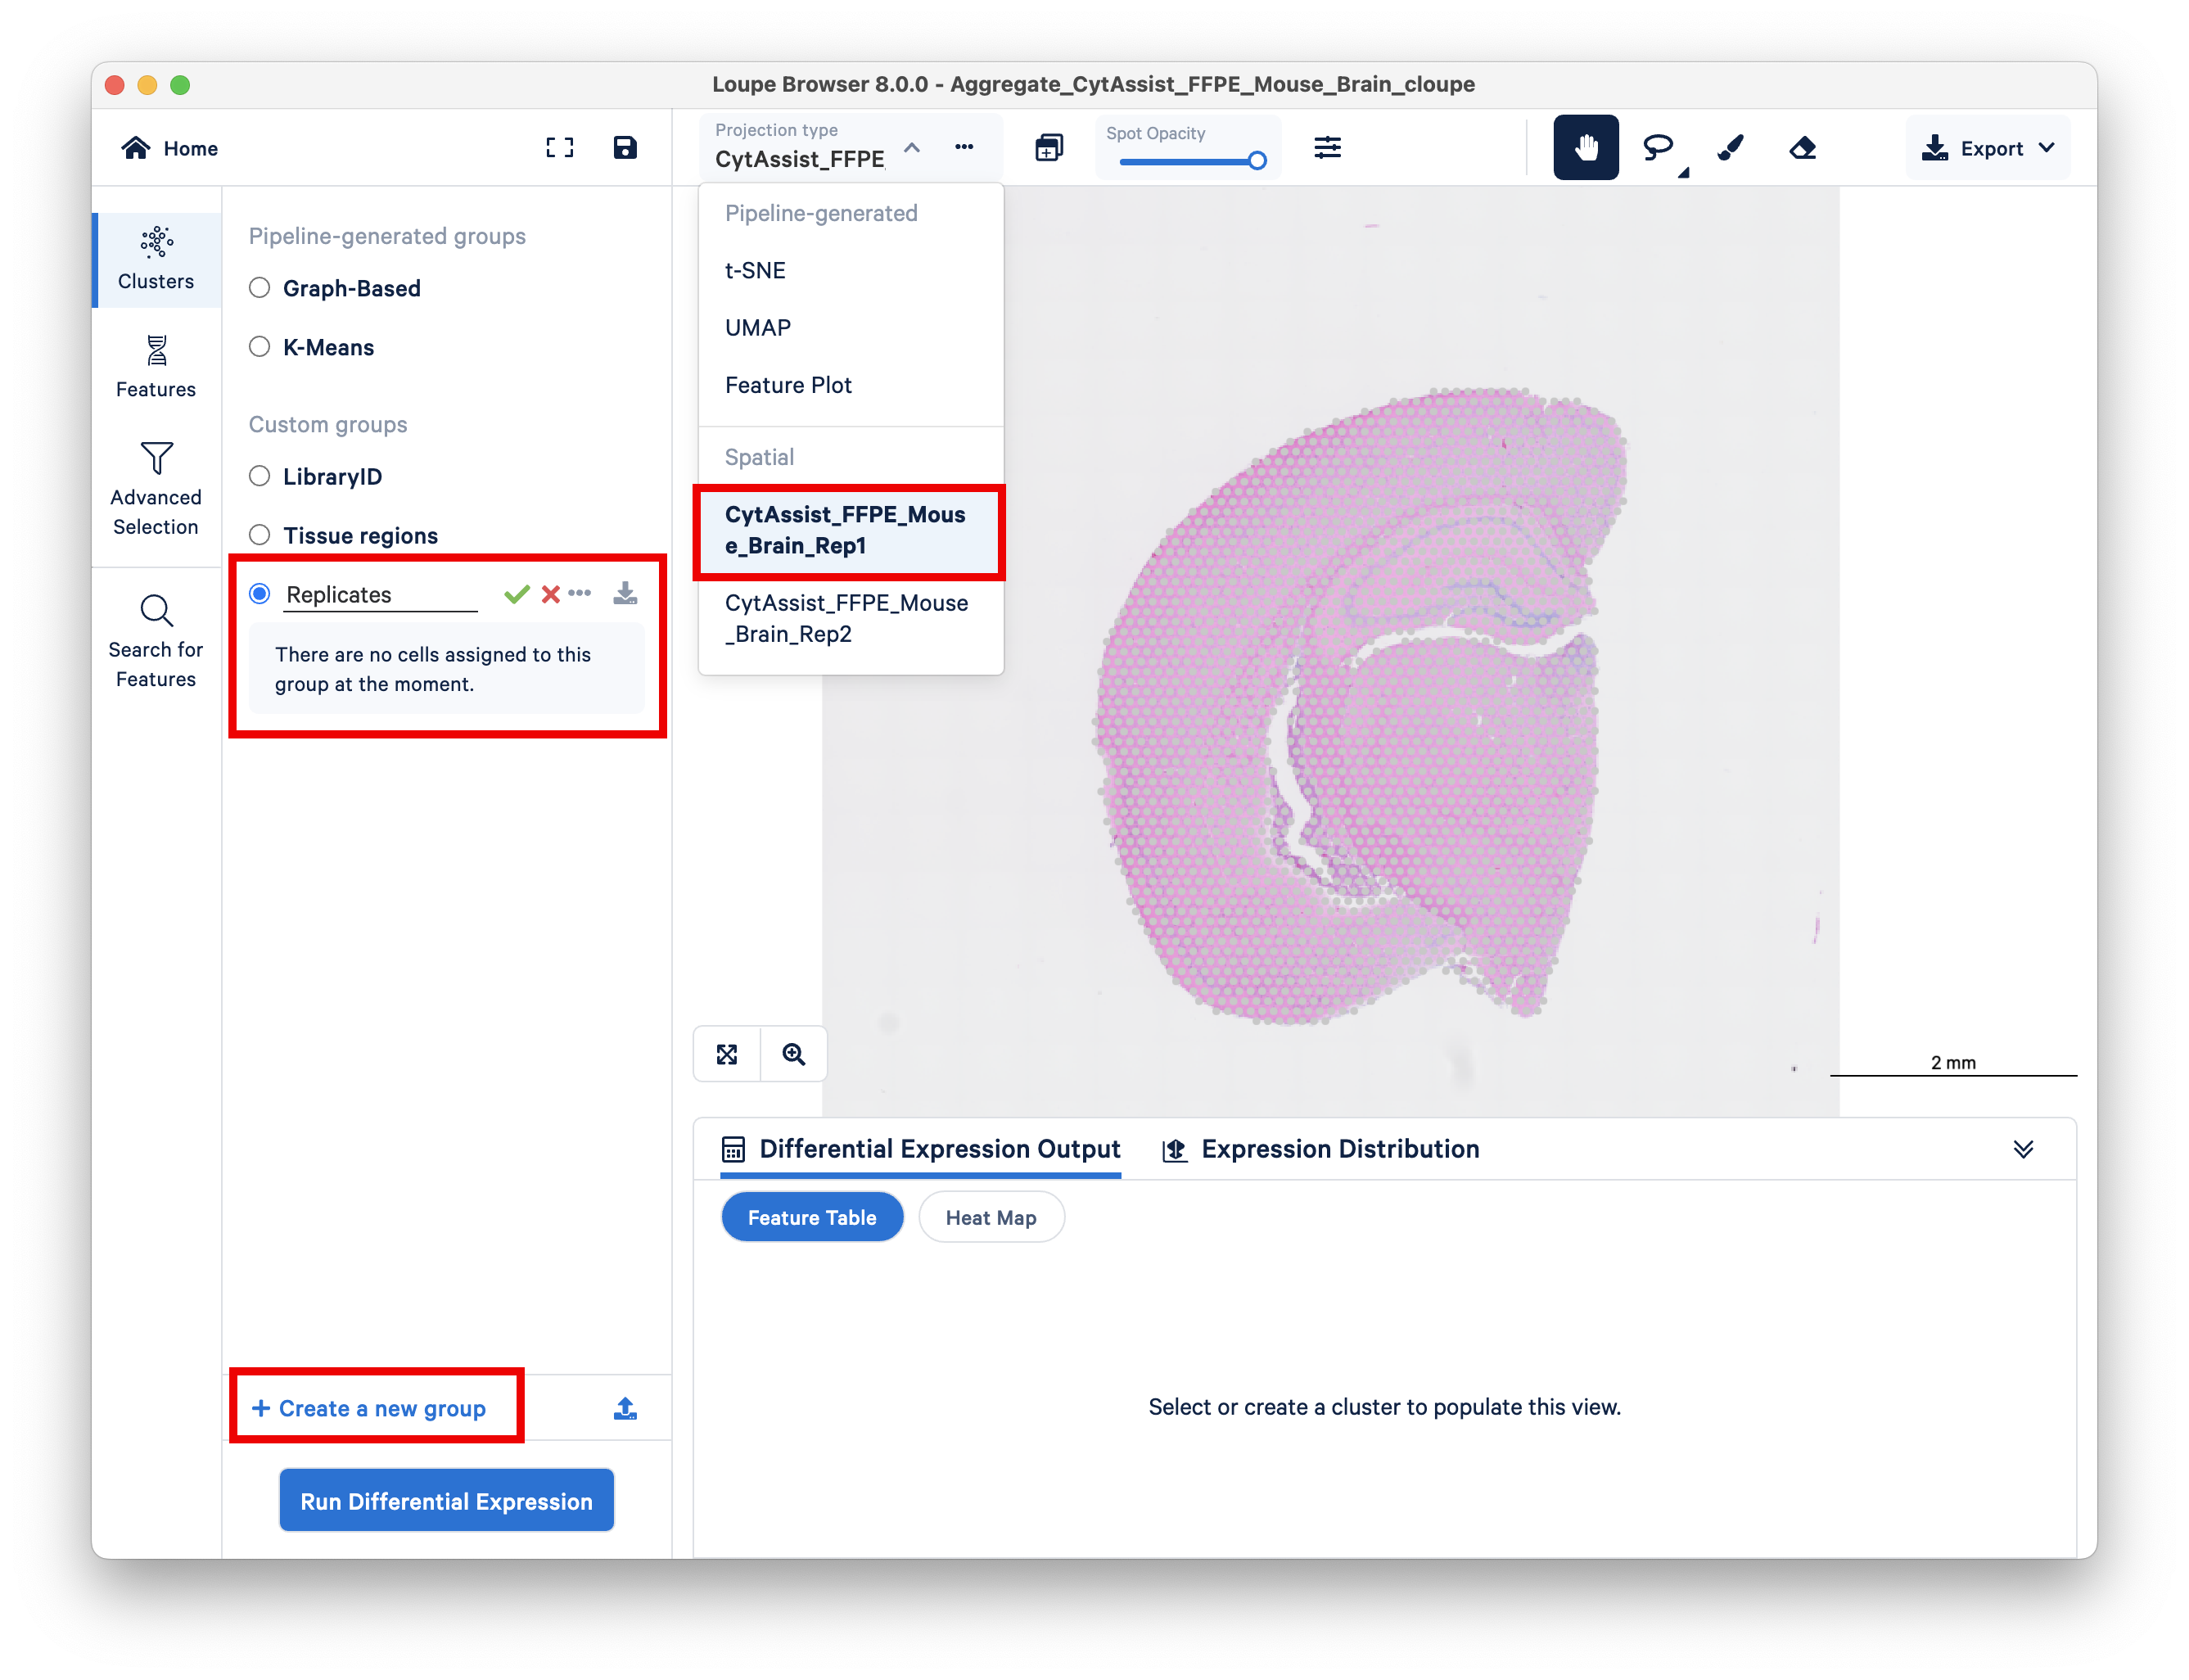
Use the brush or lasso tool to select all spots in this replicate, and assign it to a cluster called Rep1.
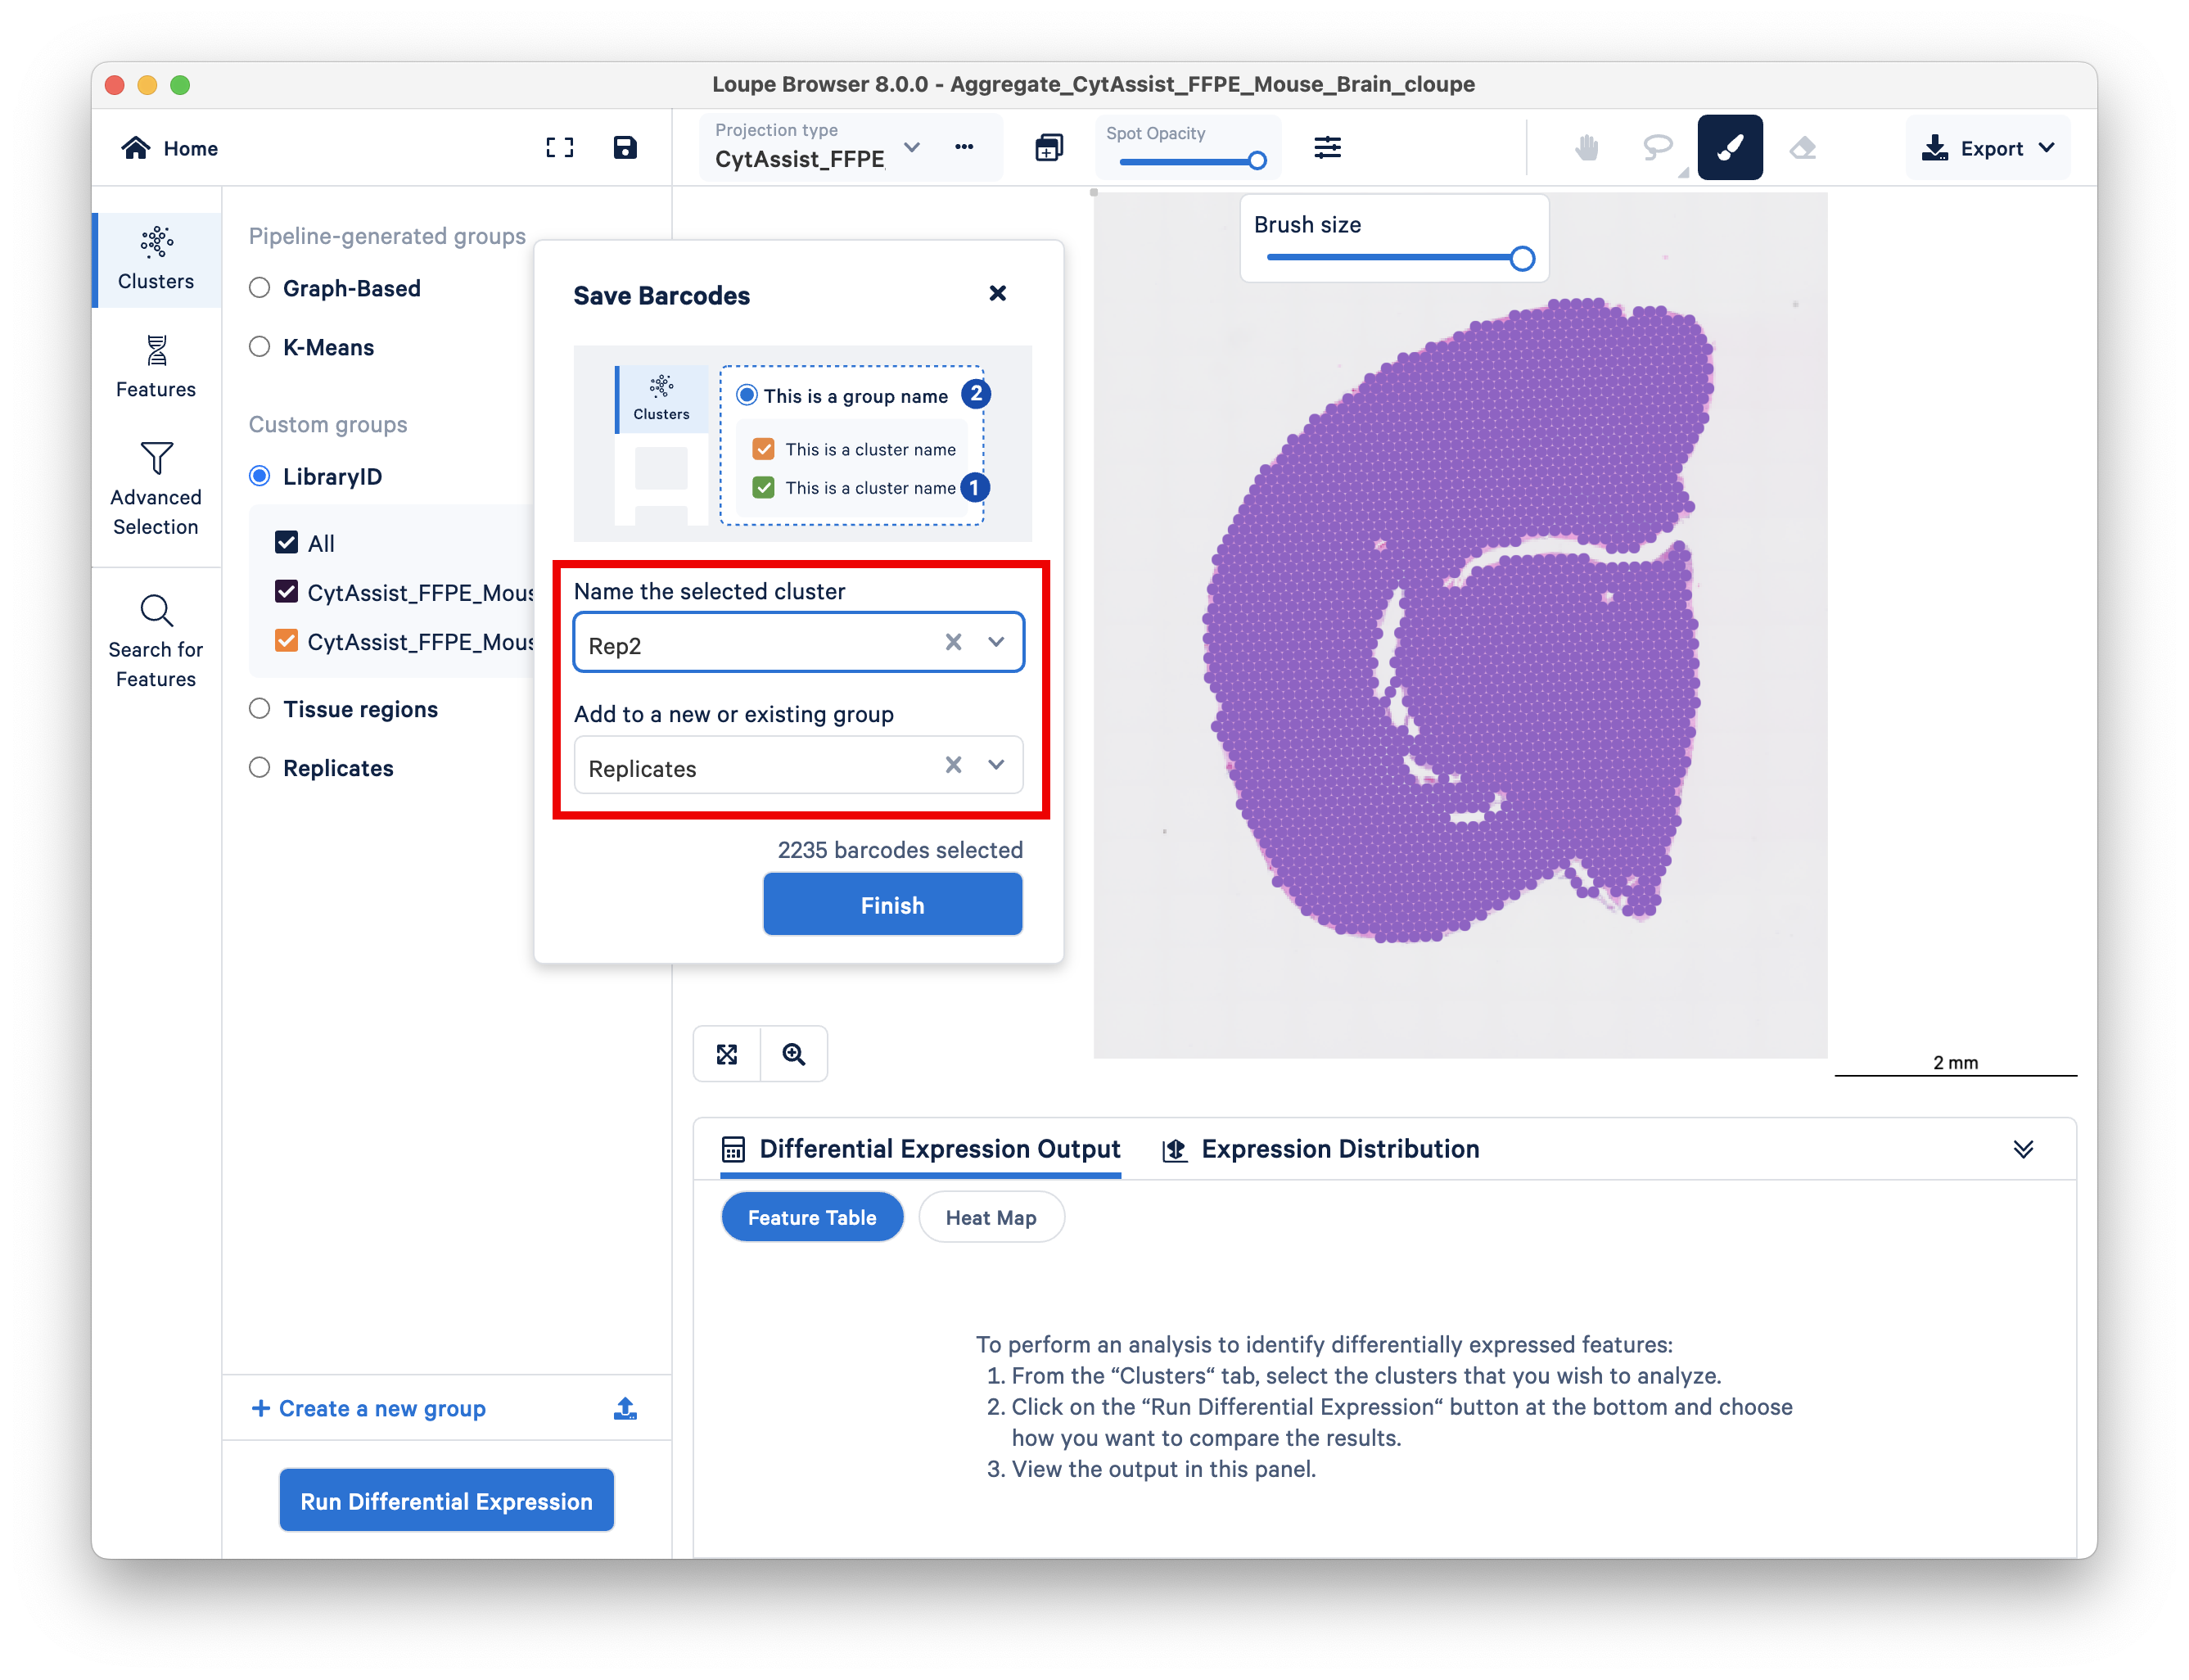
Do the same for the second replicate. Unlike the previous section, this time you want to ensure that the two replicates are assigned to different clusters.
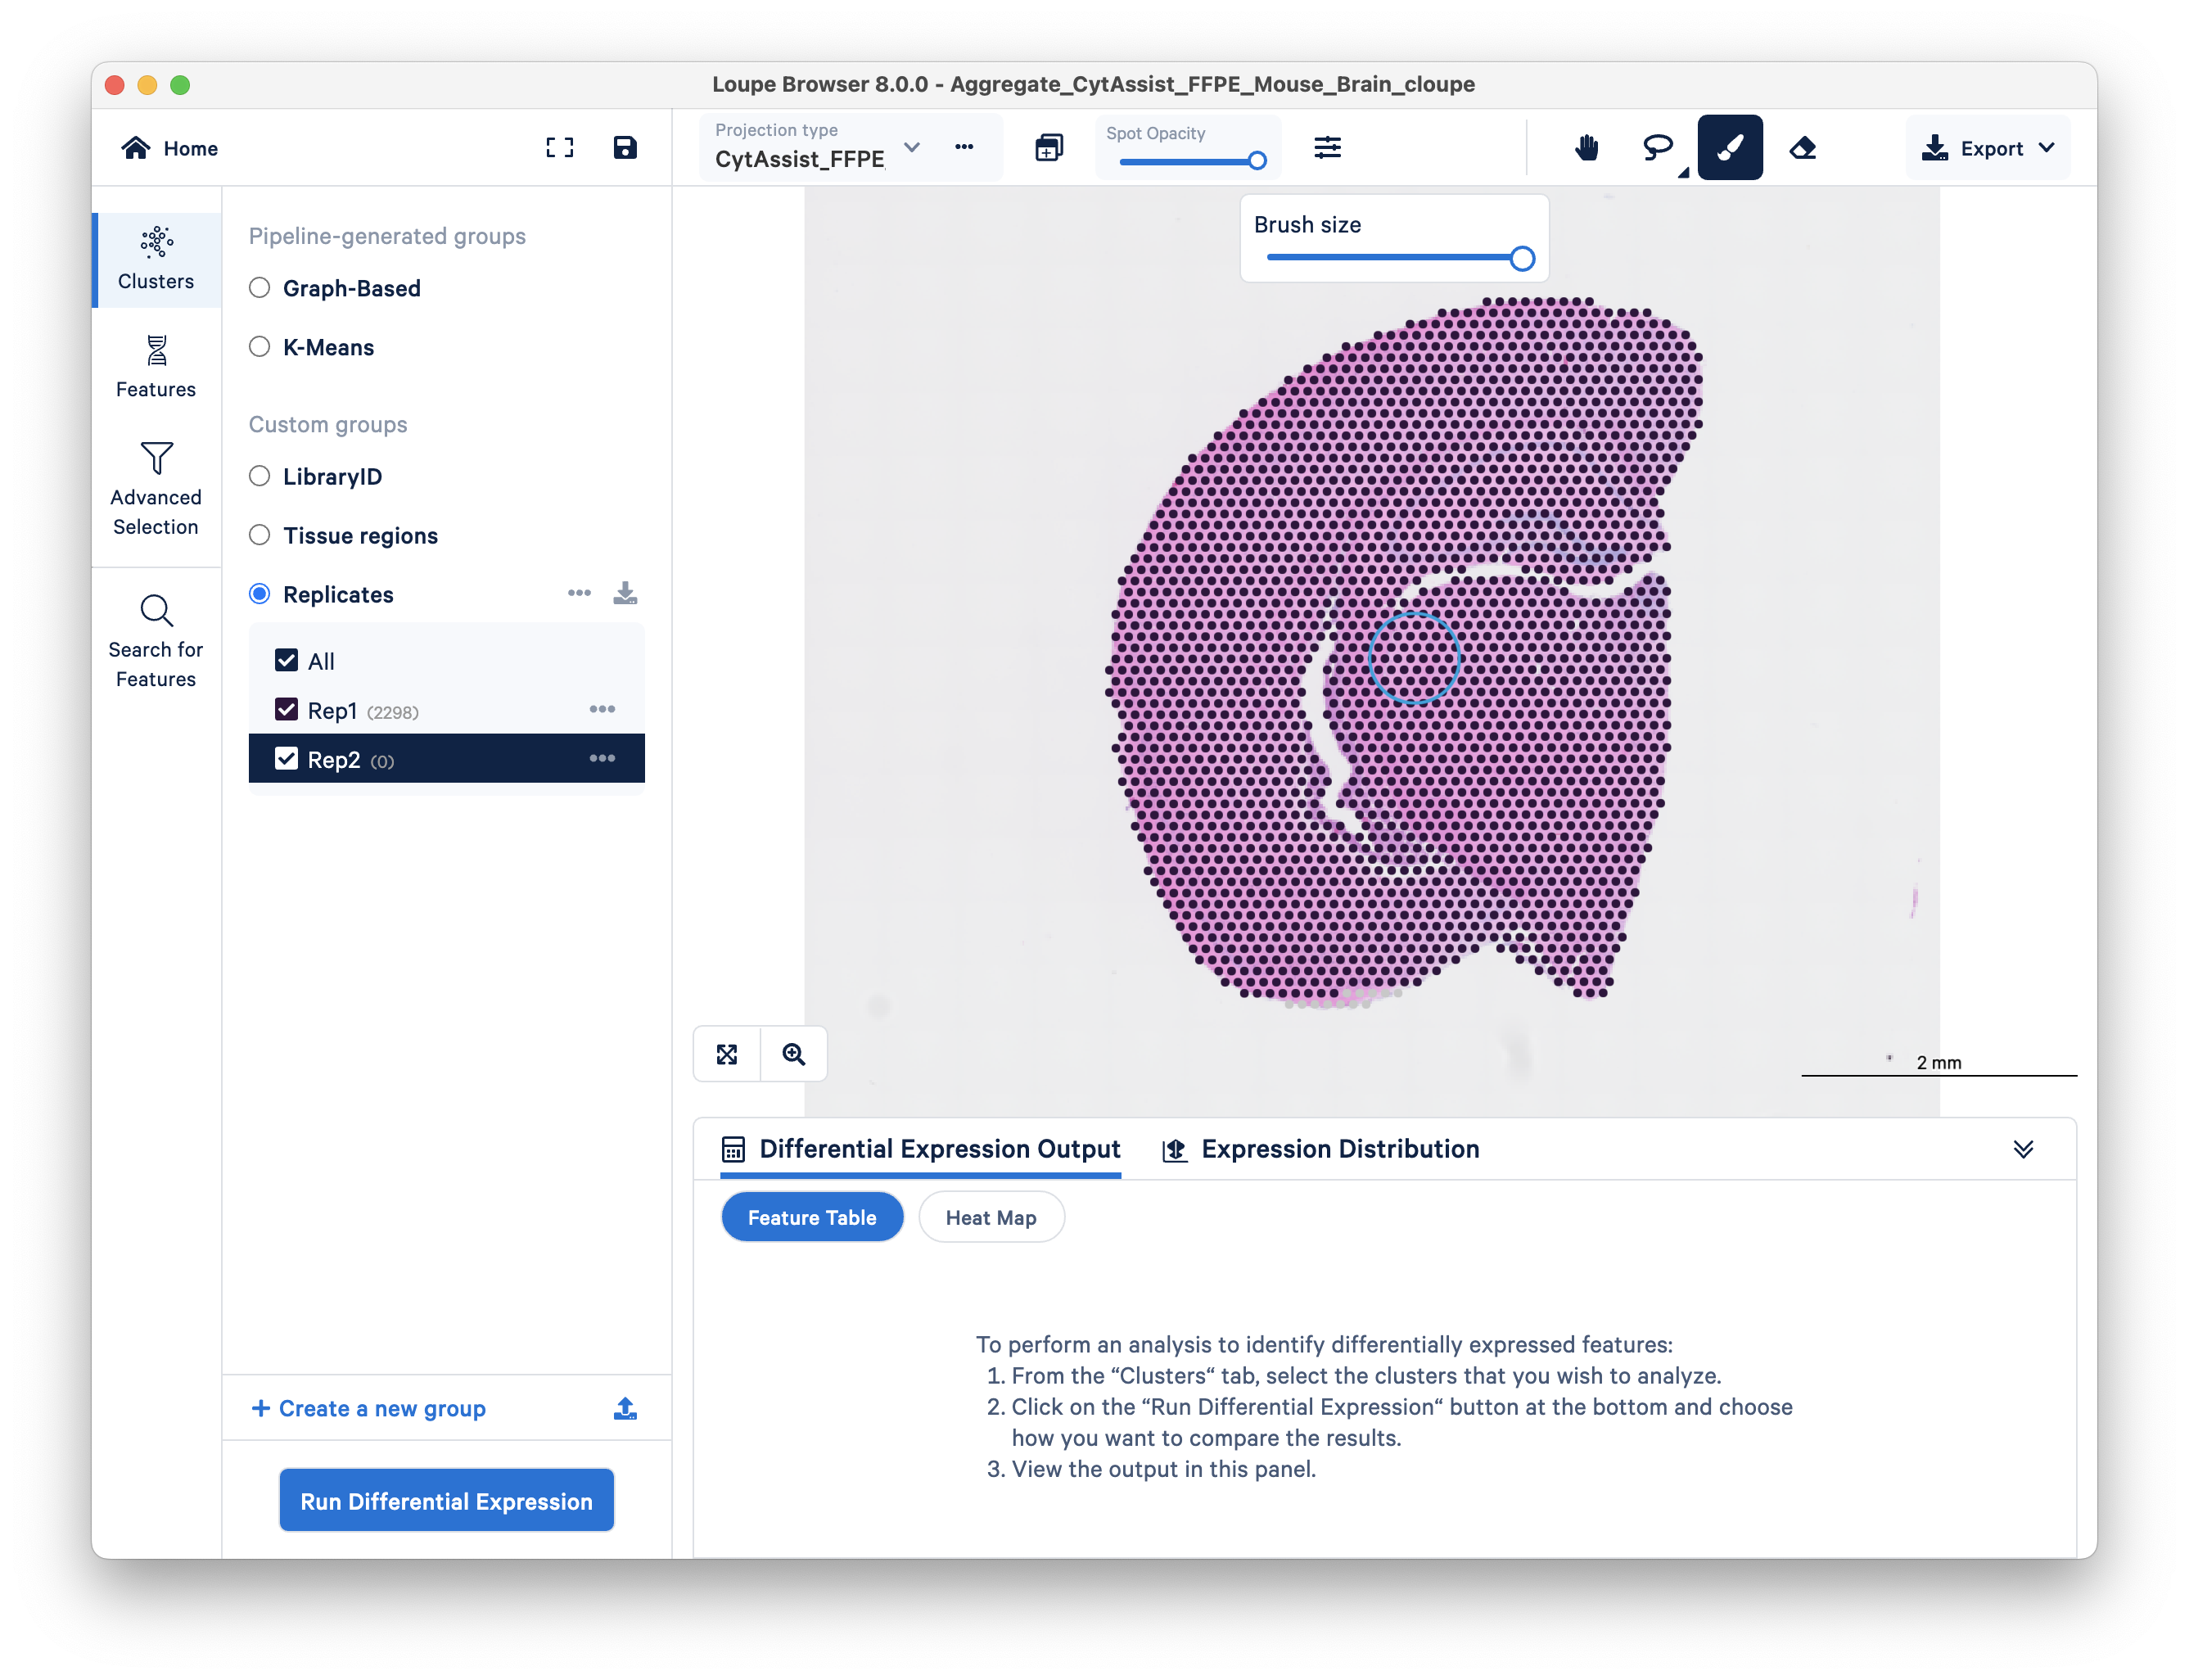
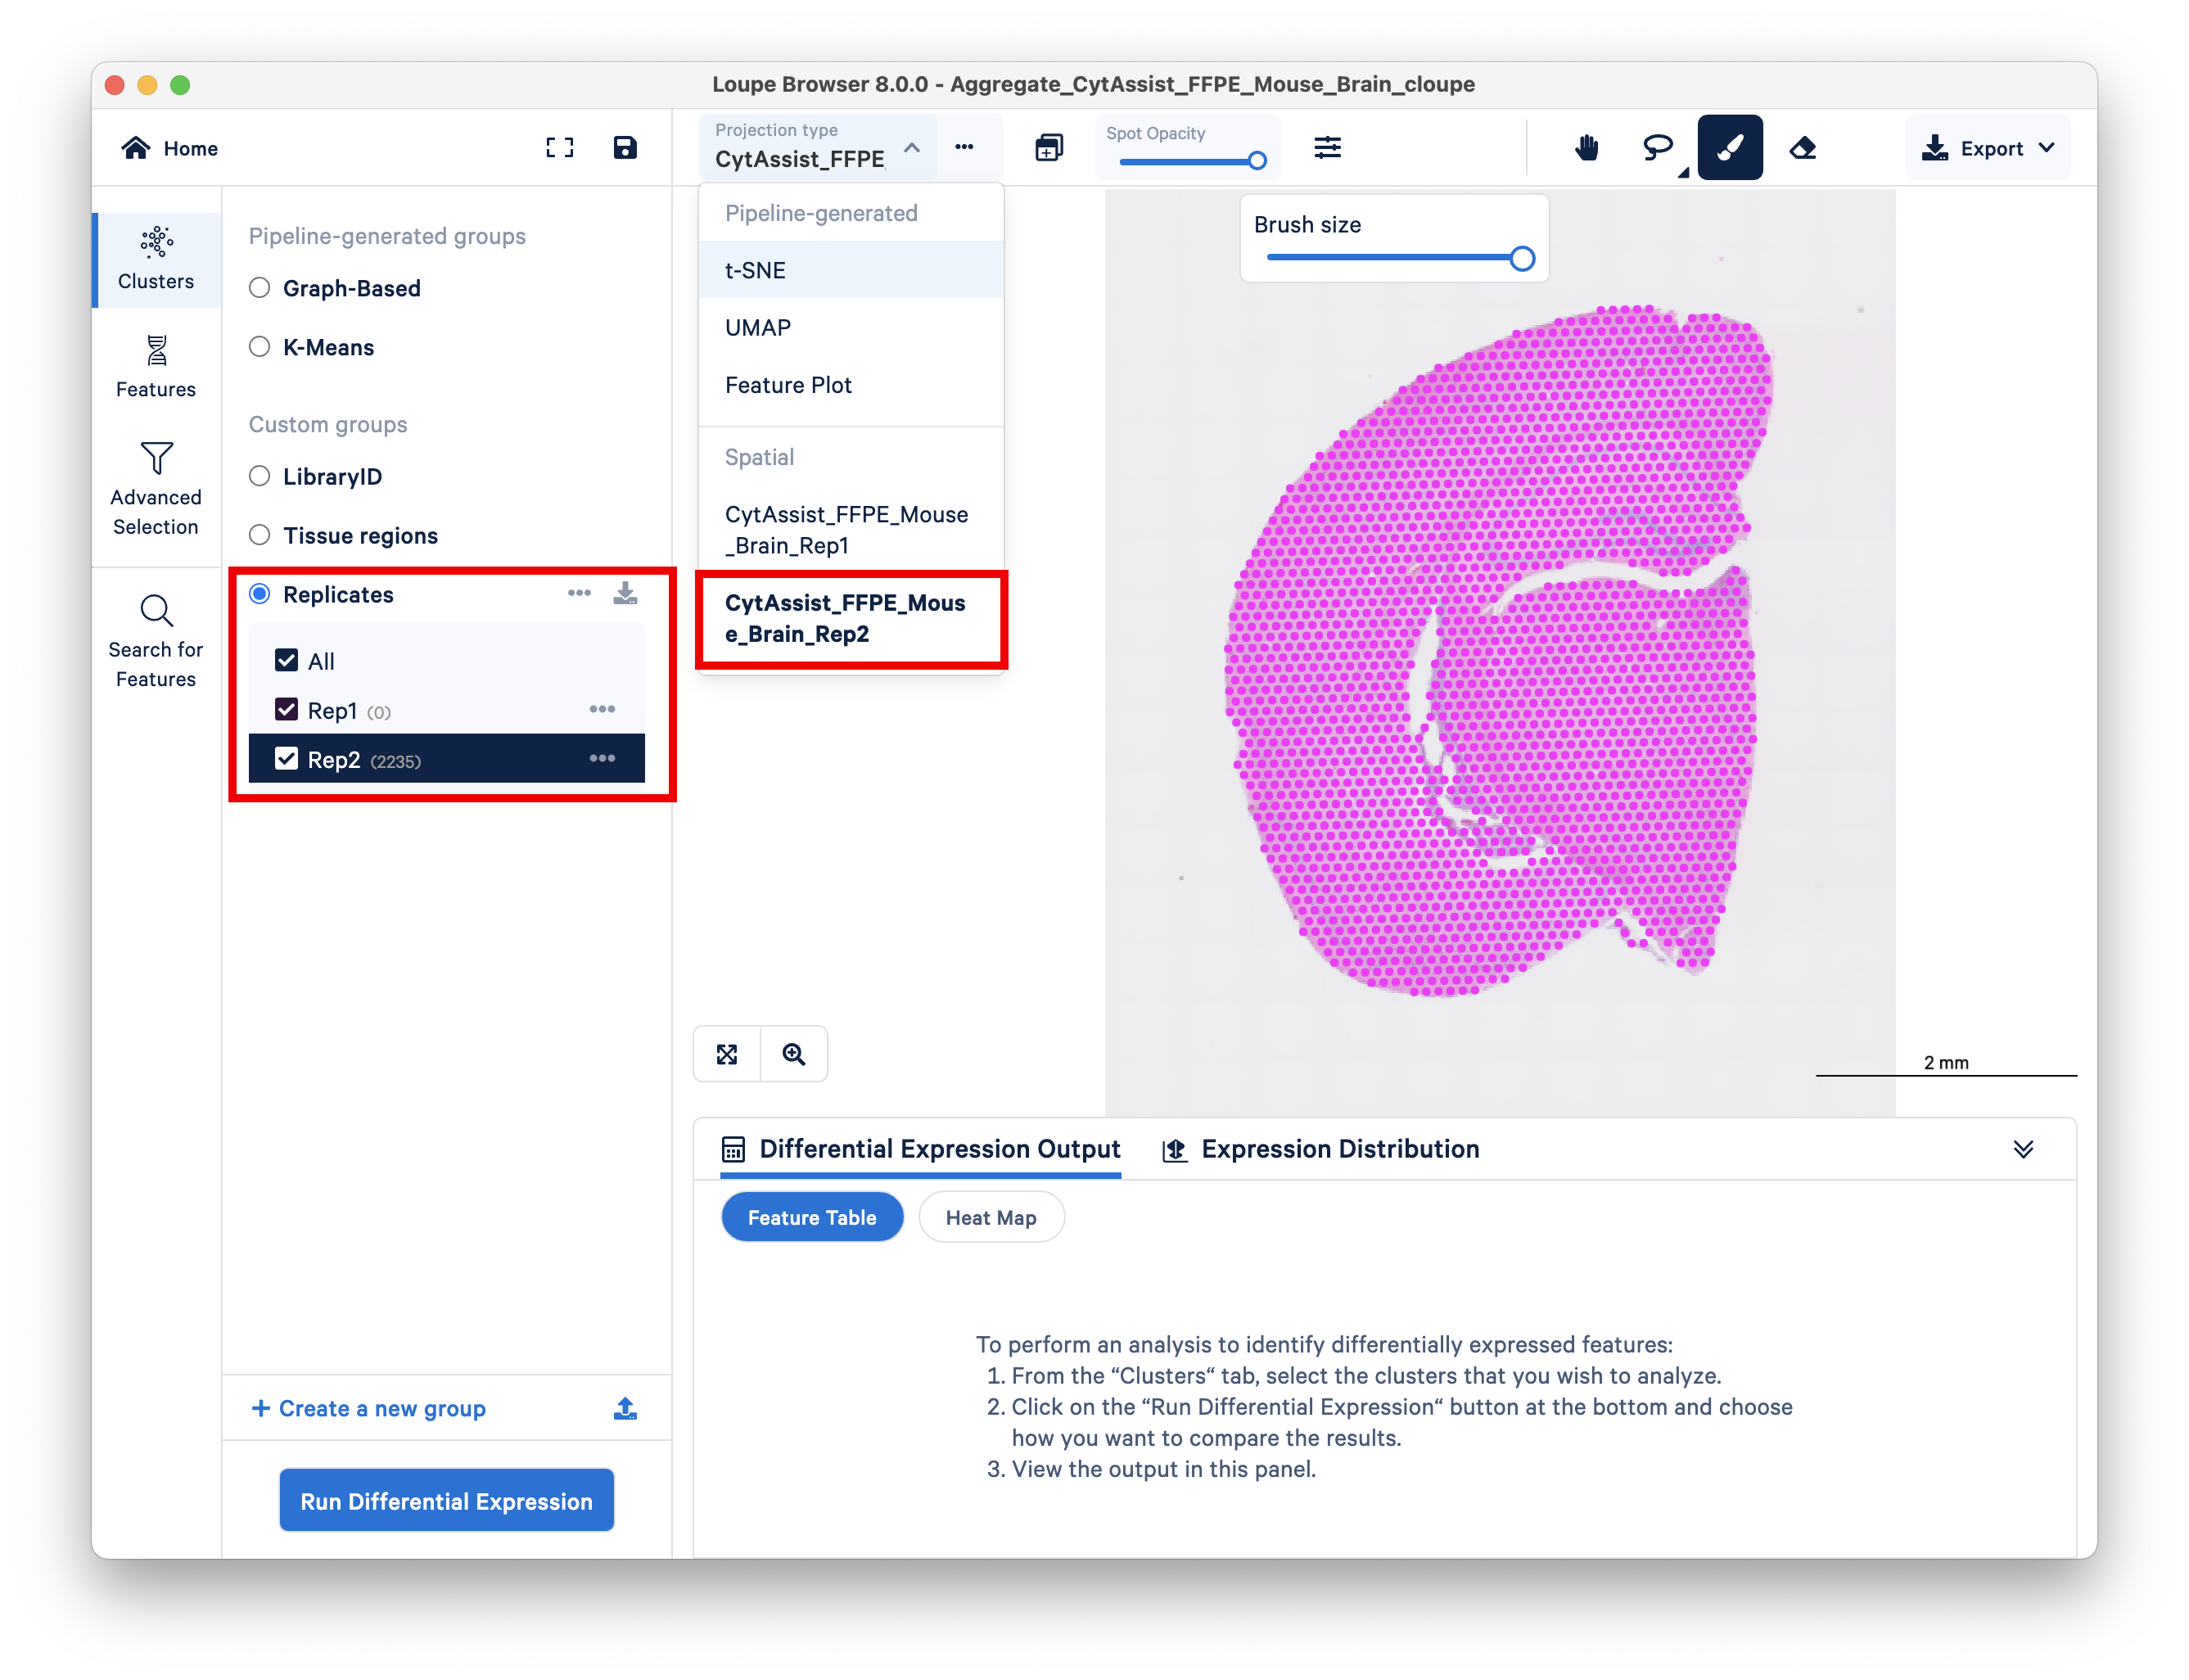
Double check that you performed this step correctly by toggling between the two replicates on top and looking at the spot counts for each cluster on the left side.
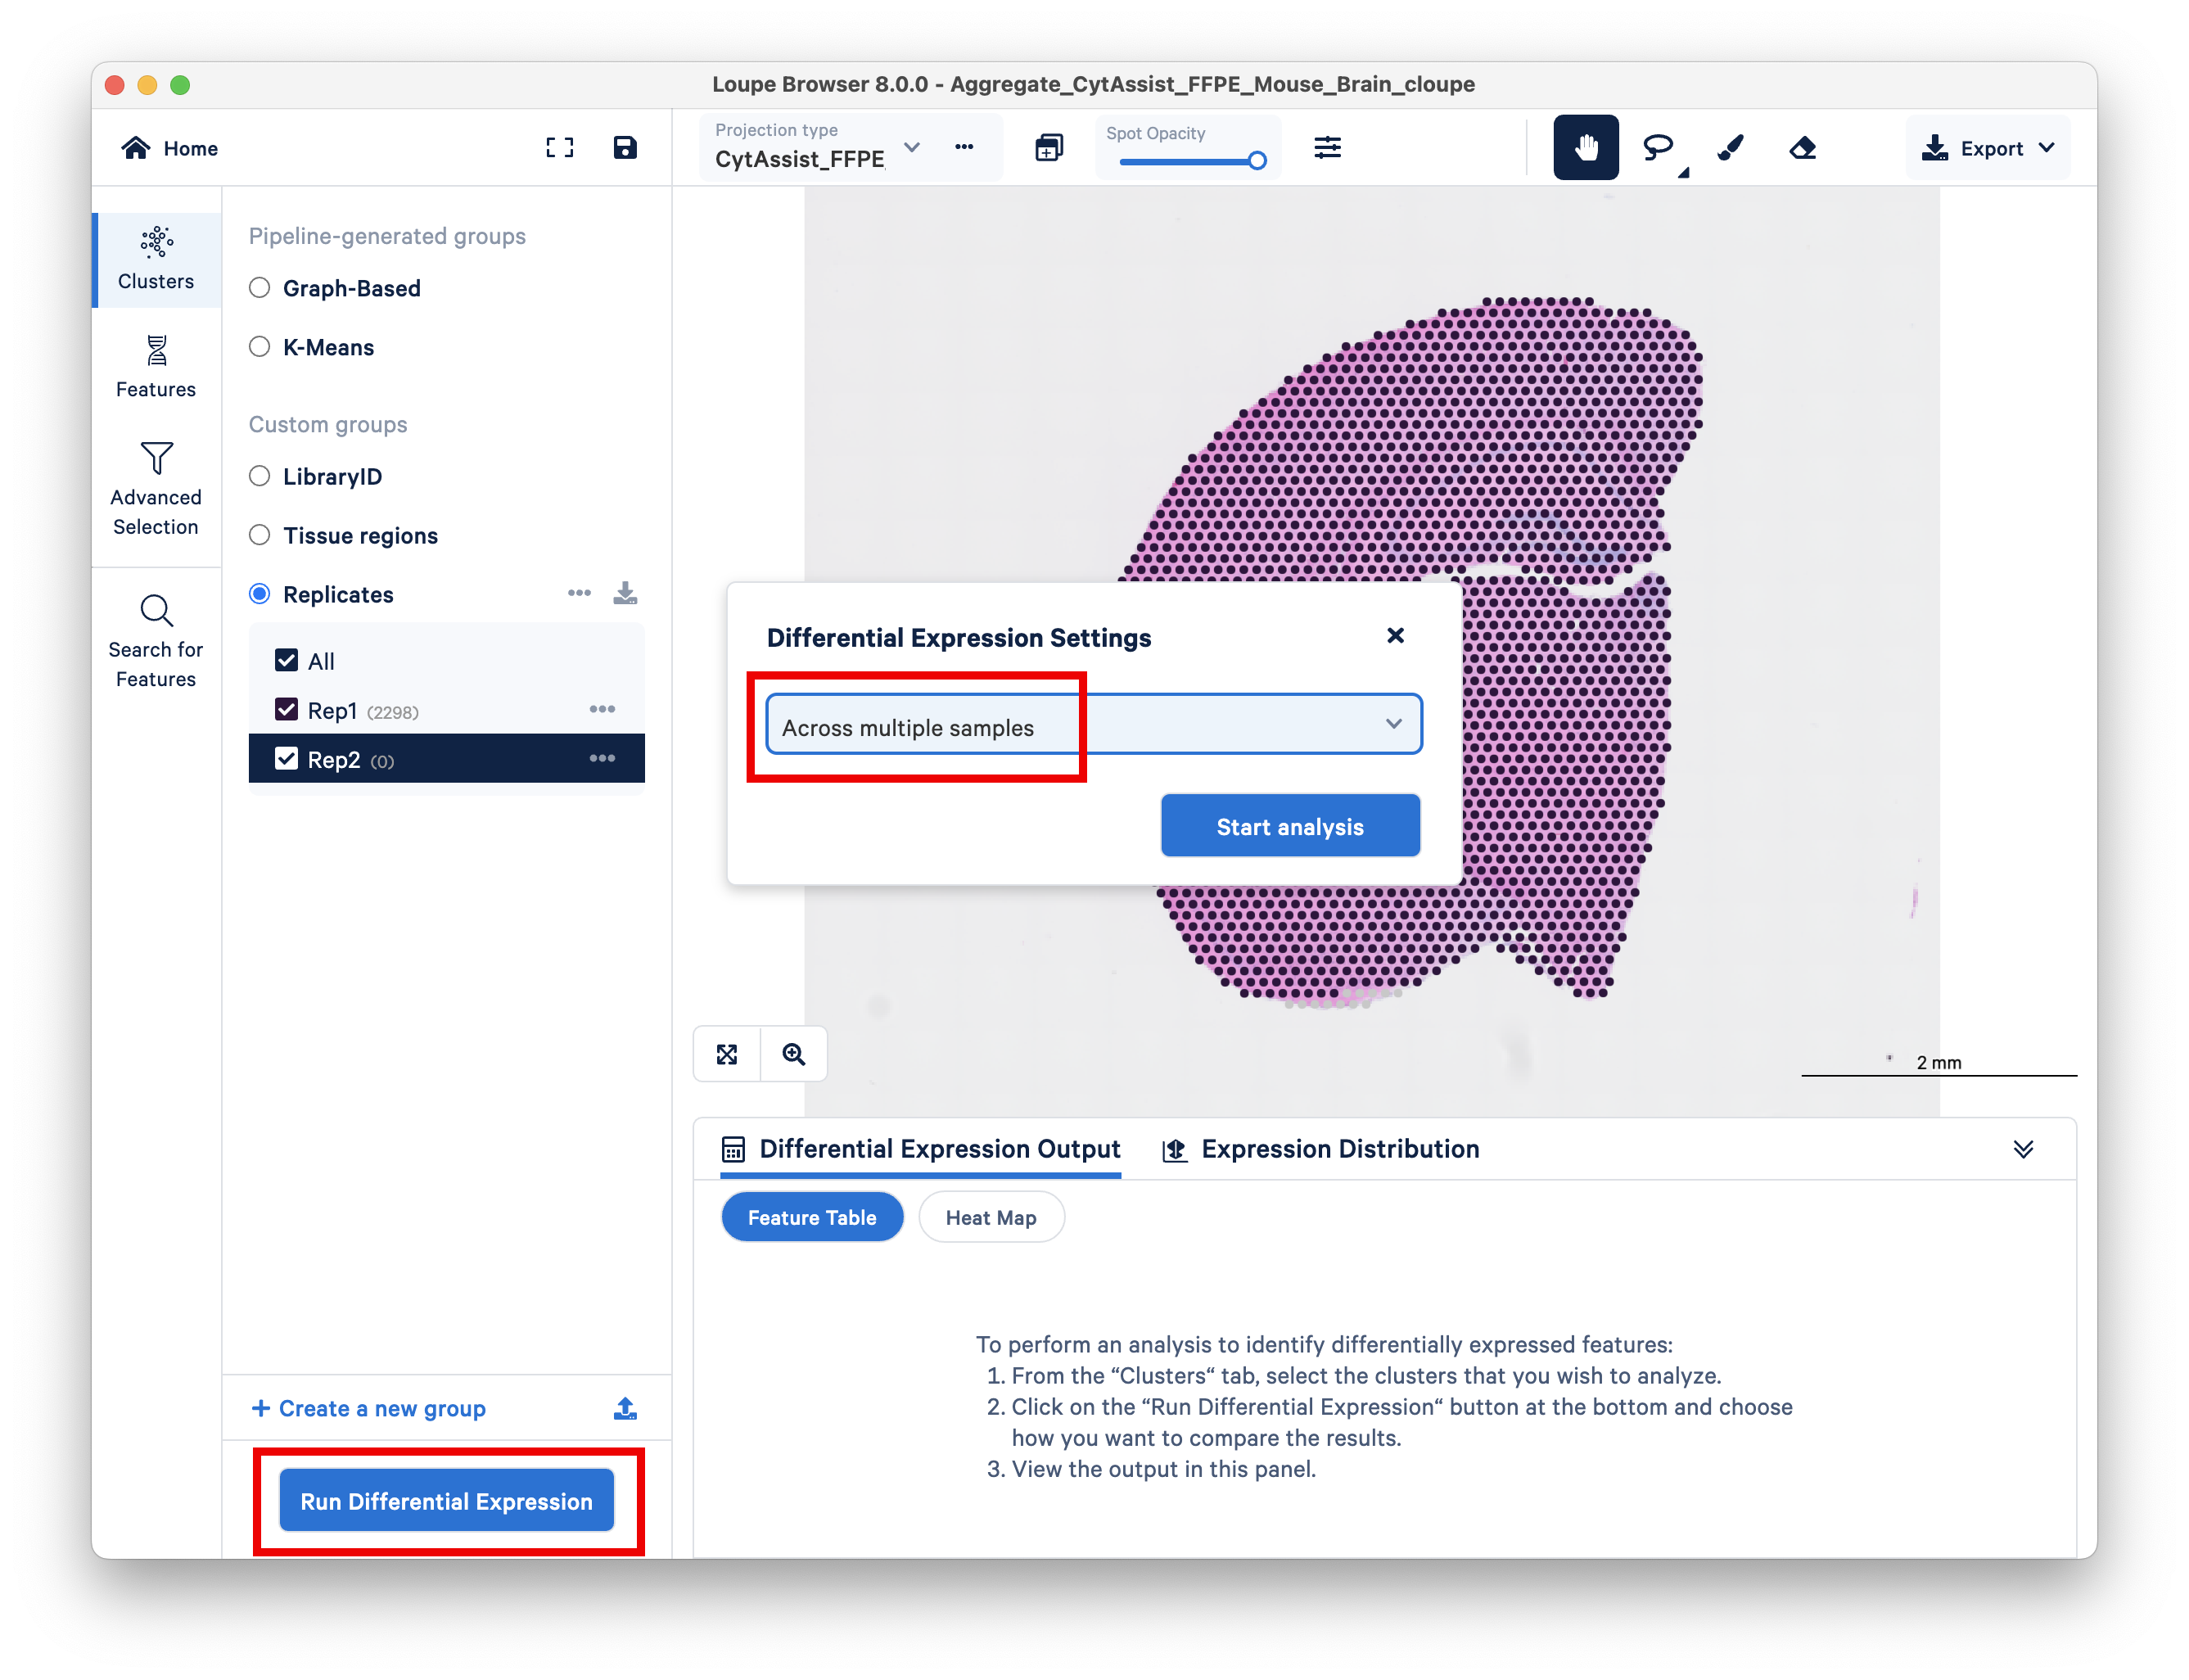
You are now ready to click on Run Differential Expression on the bottom left. When prompted, choose Across multiple samples.
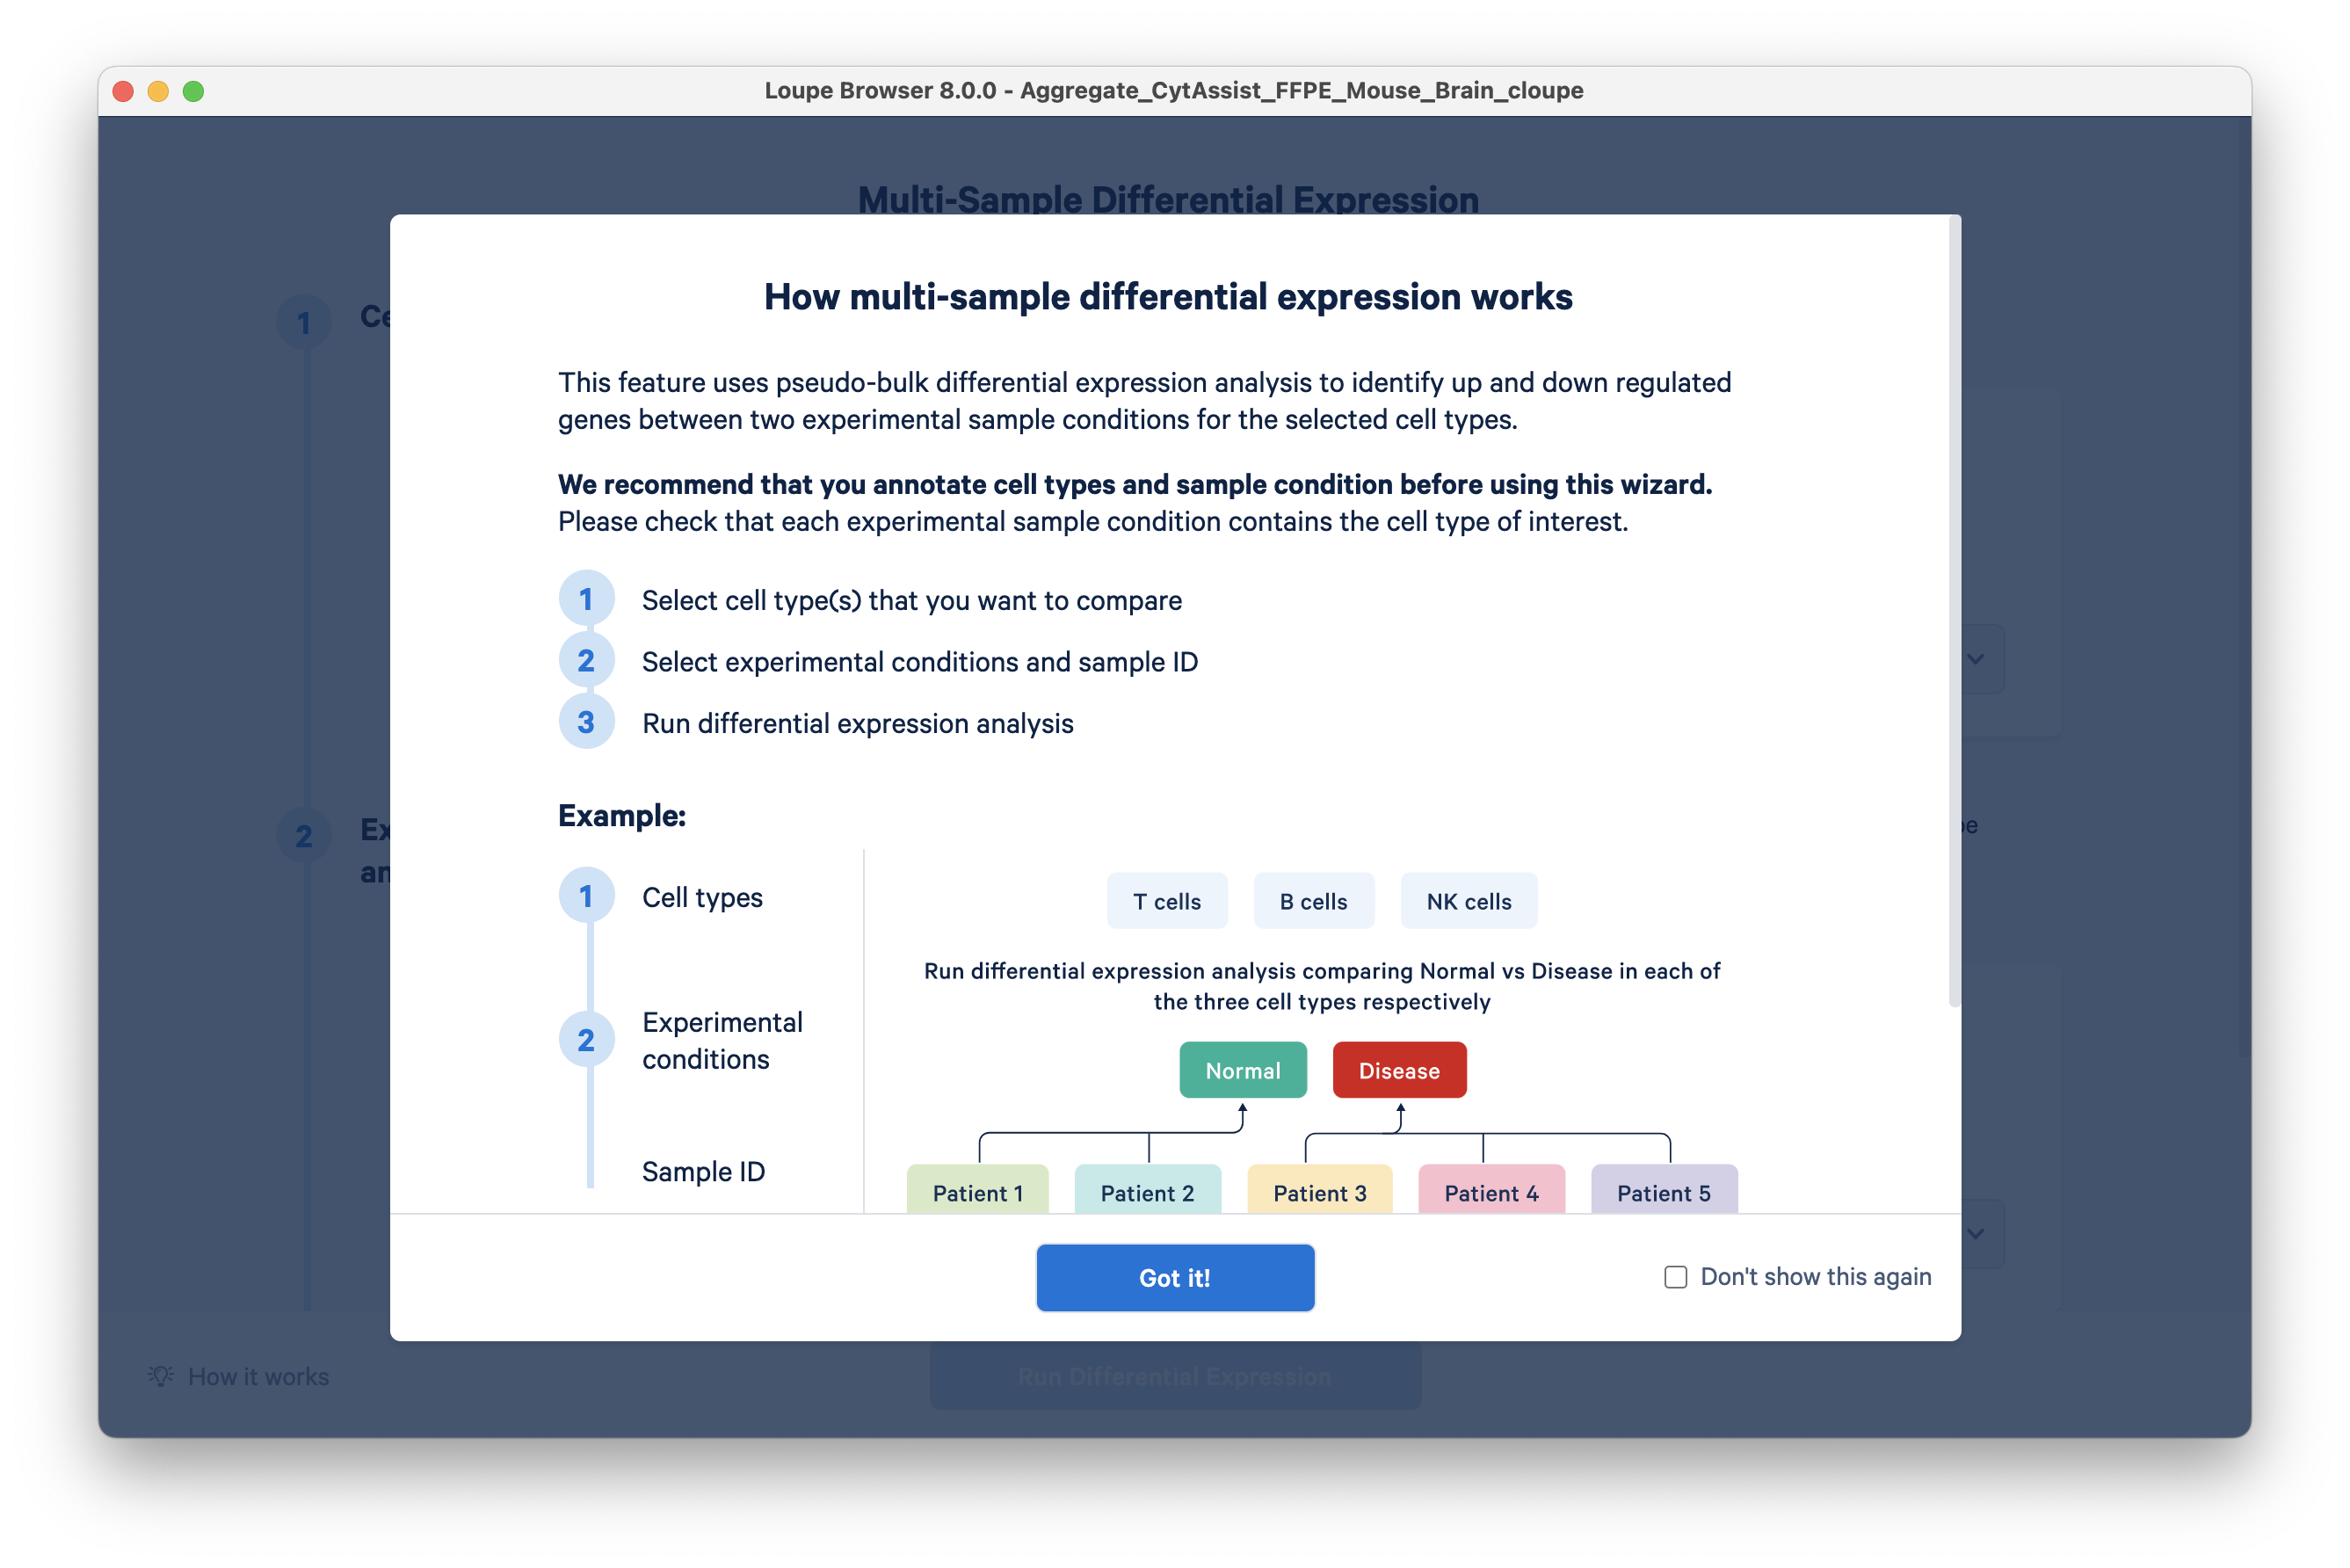
An overview screen will pop up, click Got it! to continue.
Set up the analysis as follows:
- Under the first header for cell types, choose Tissue regions for the group and Hippocampus region for the cell types.
- For experimental conditions, choose group LibraryID, and set the two replicates as experimental conditions A and B.
- For the sample IDs, choose Replicates as the group and set Rep1 and Rep2 as conditions A and B.
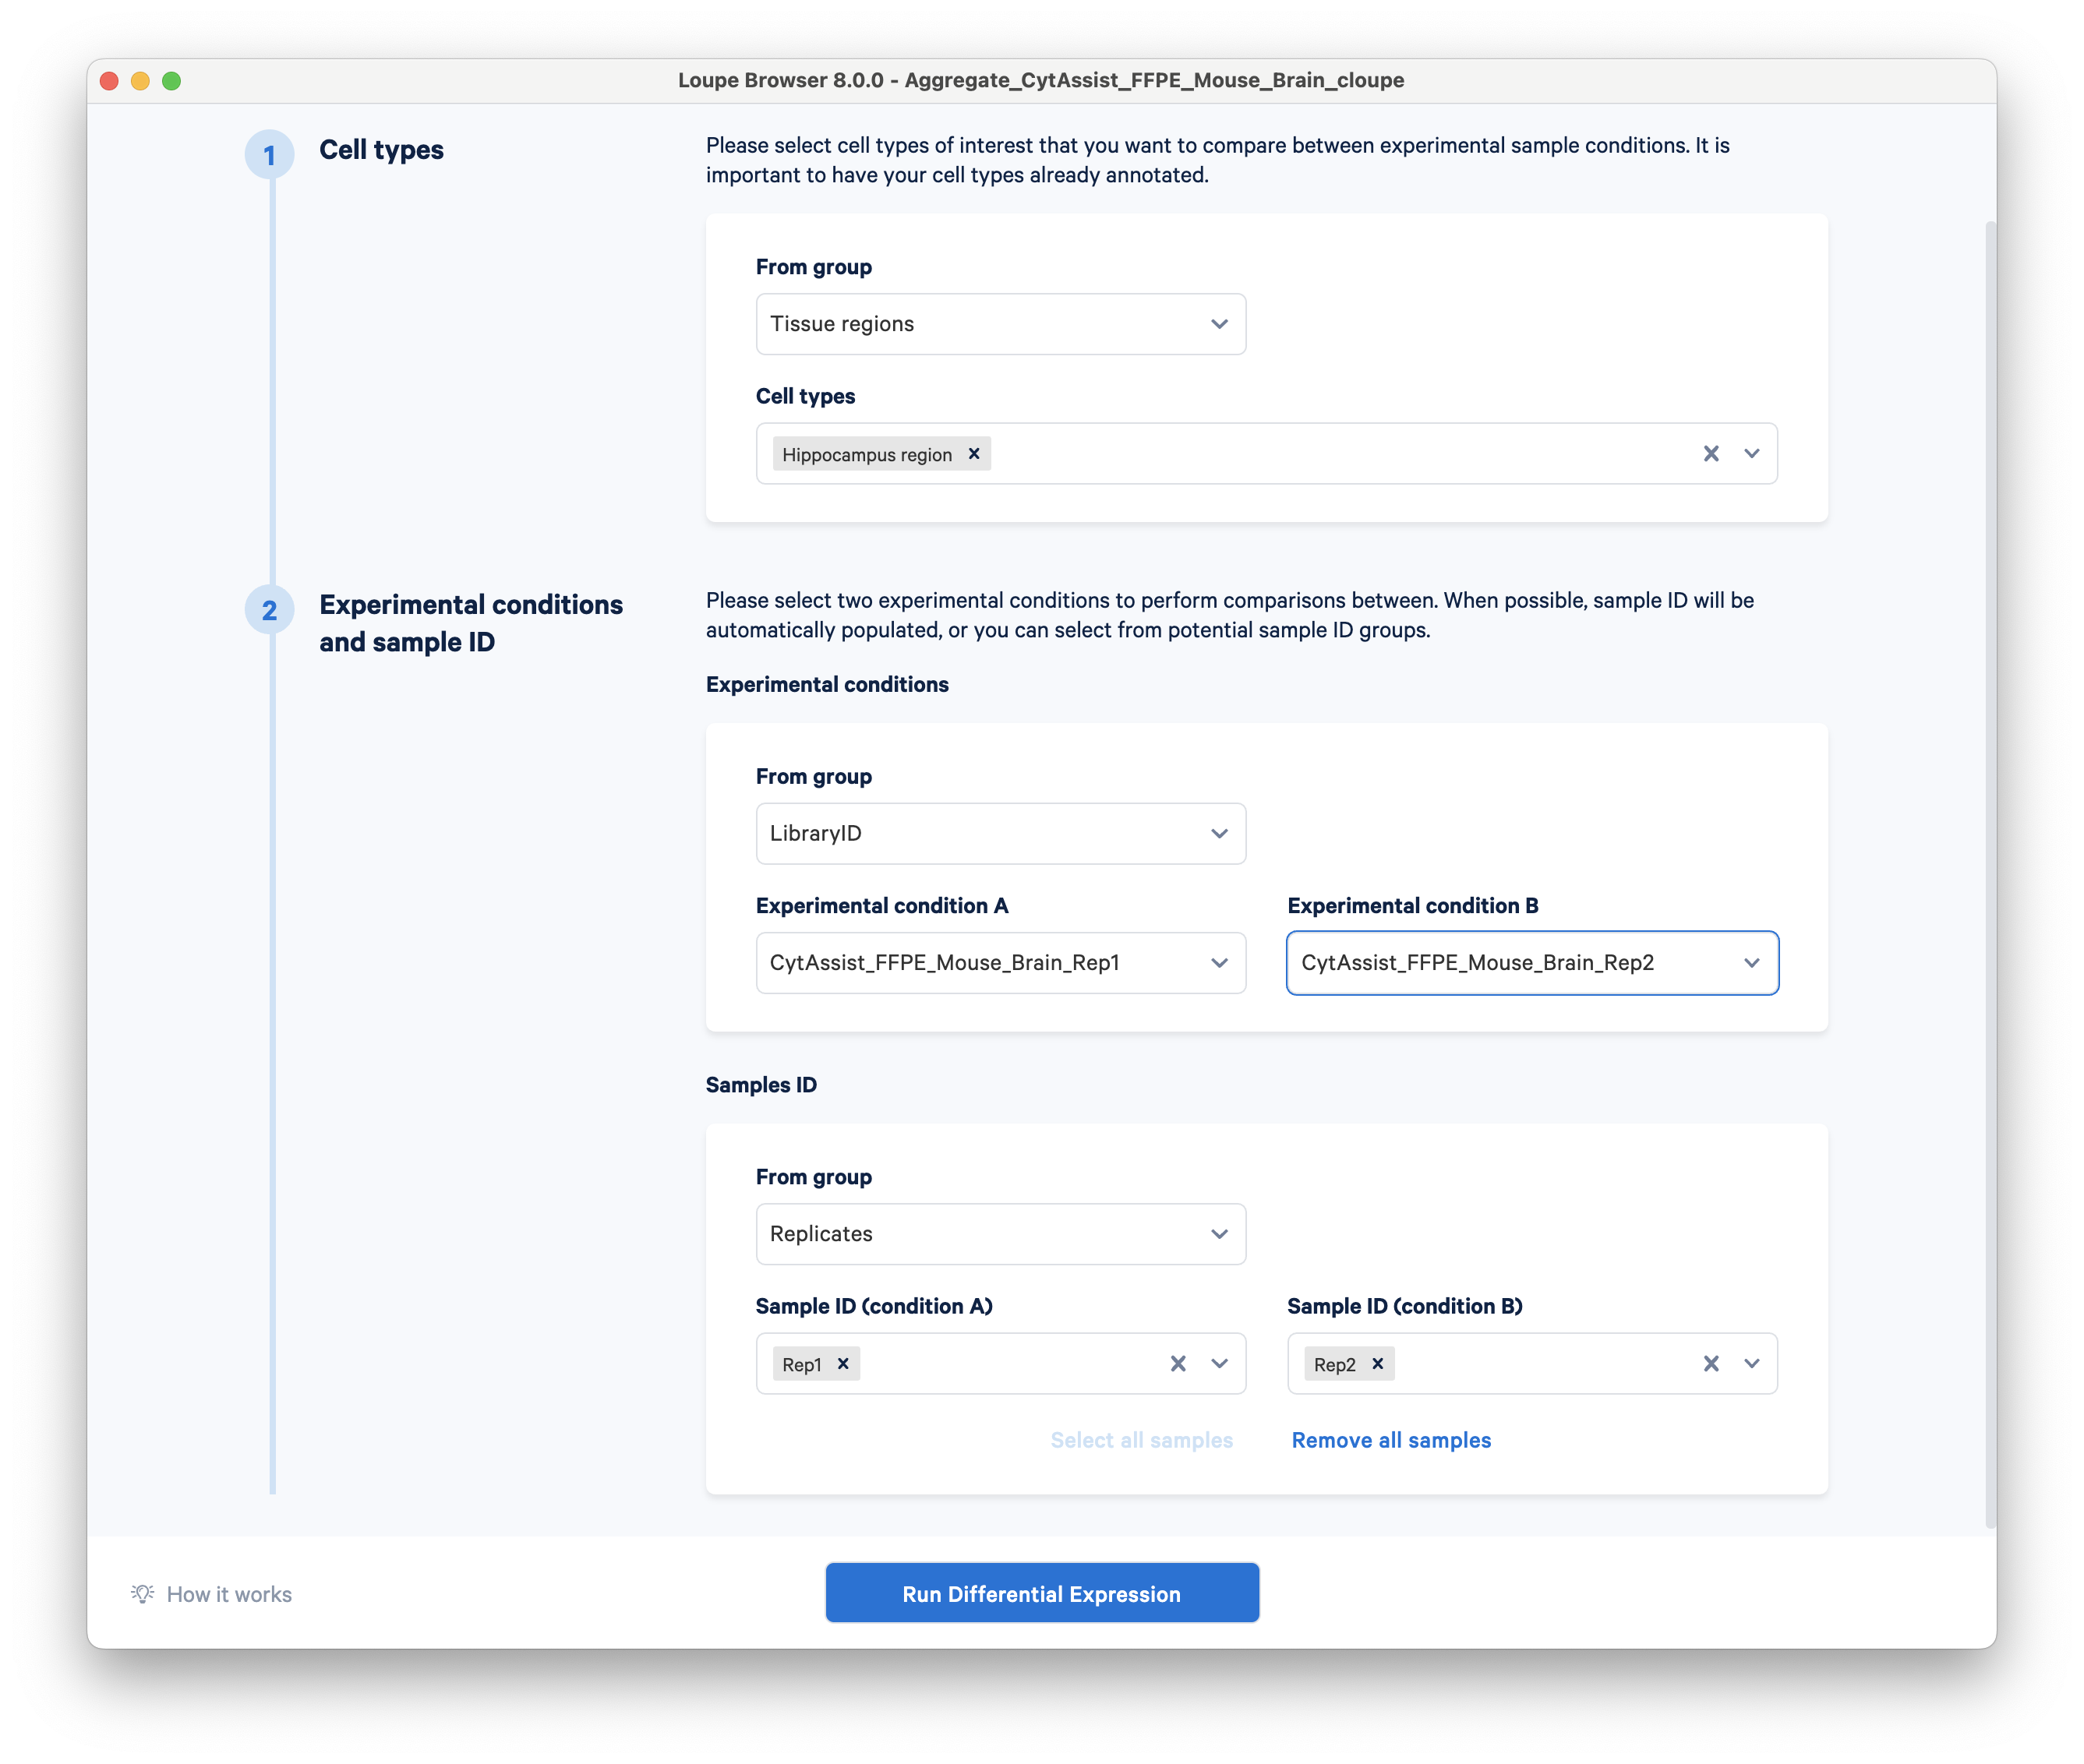
Click Run Differential Expression. For this dataset, the analysis should only take a few seconds to complete.
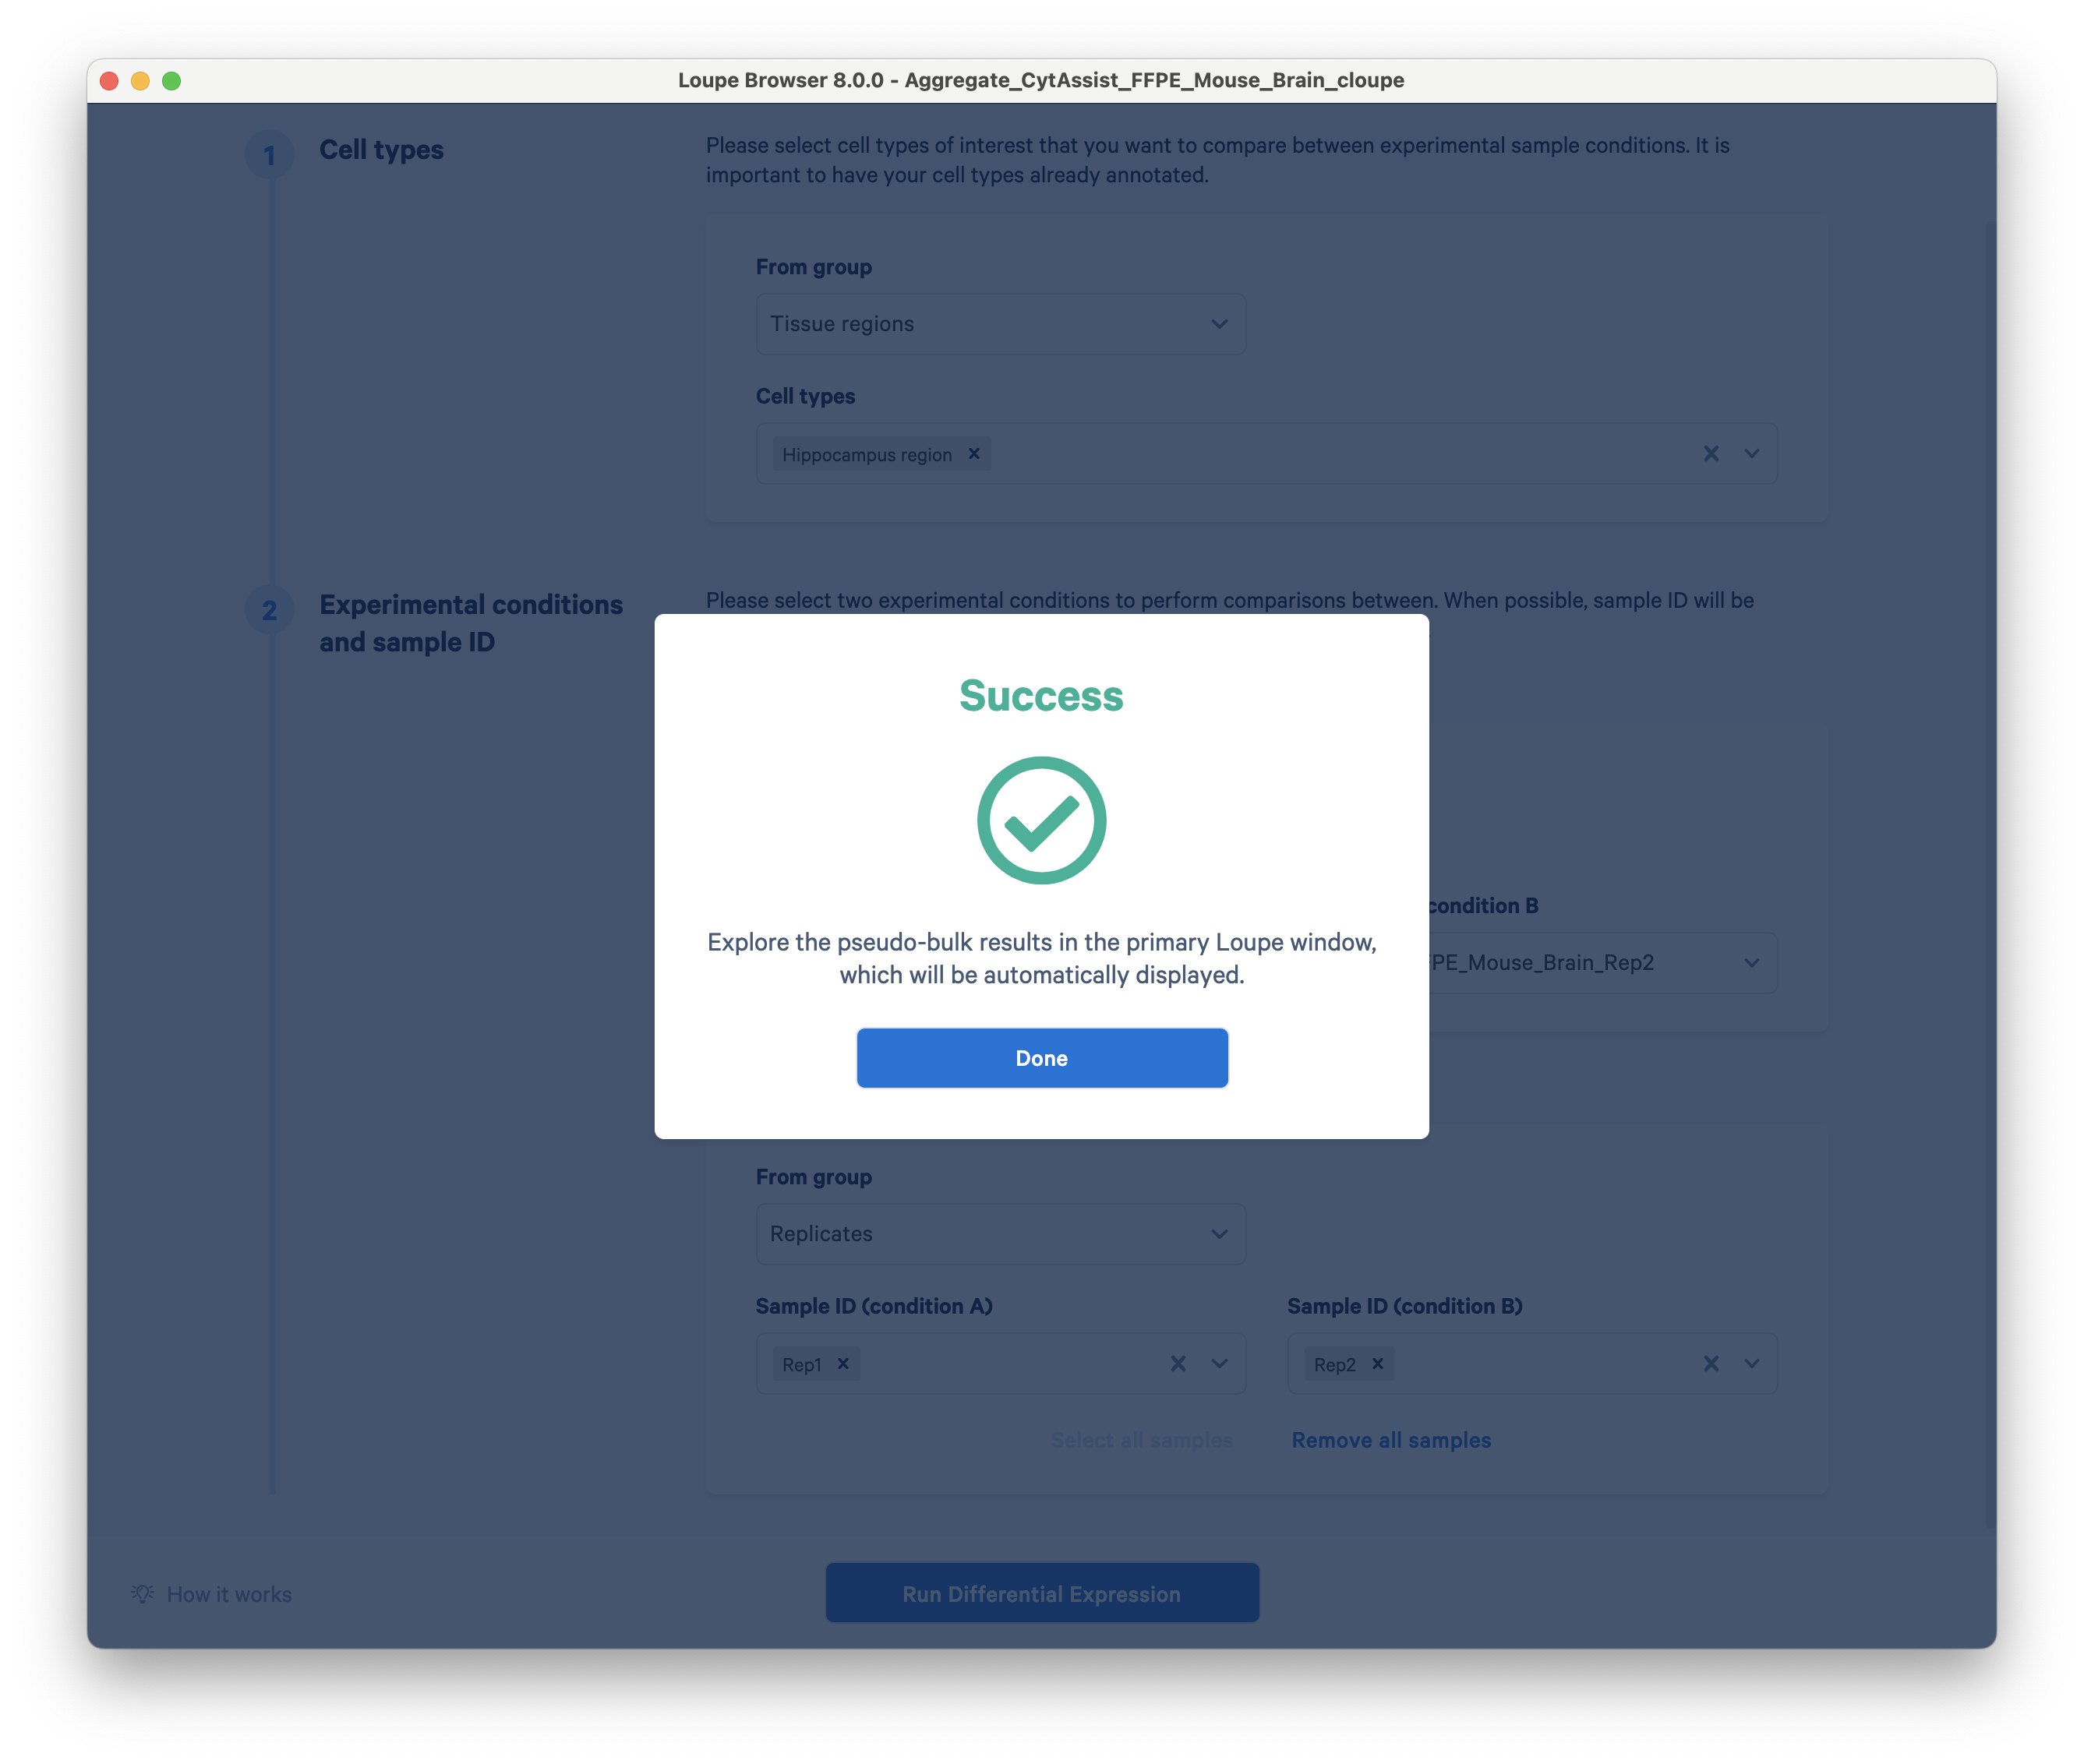
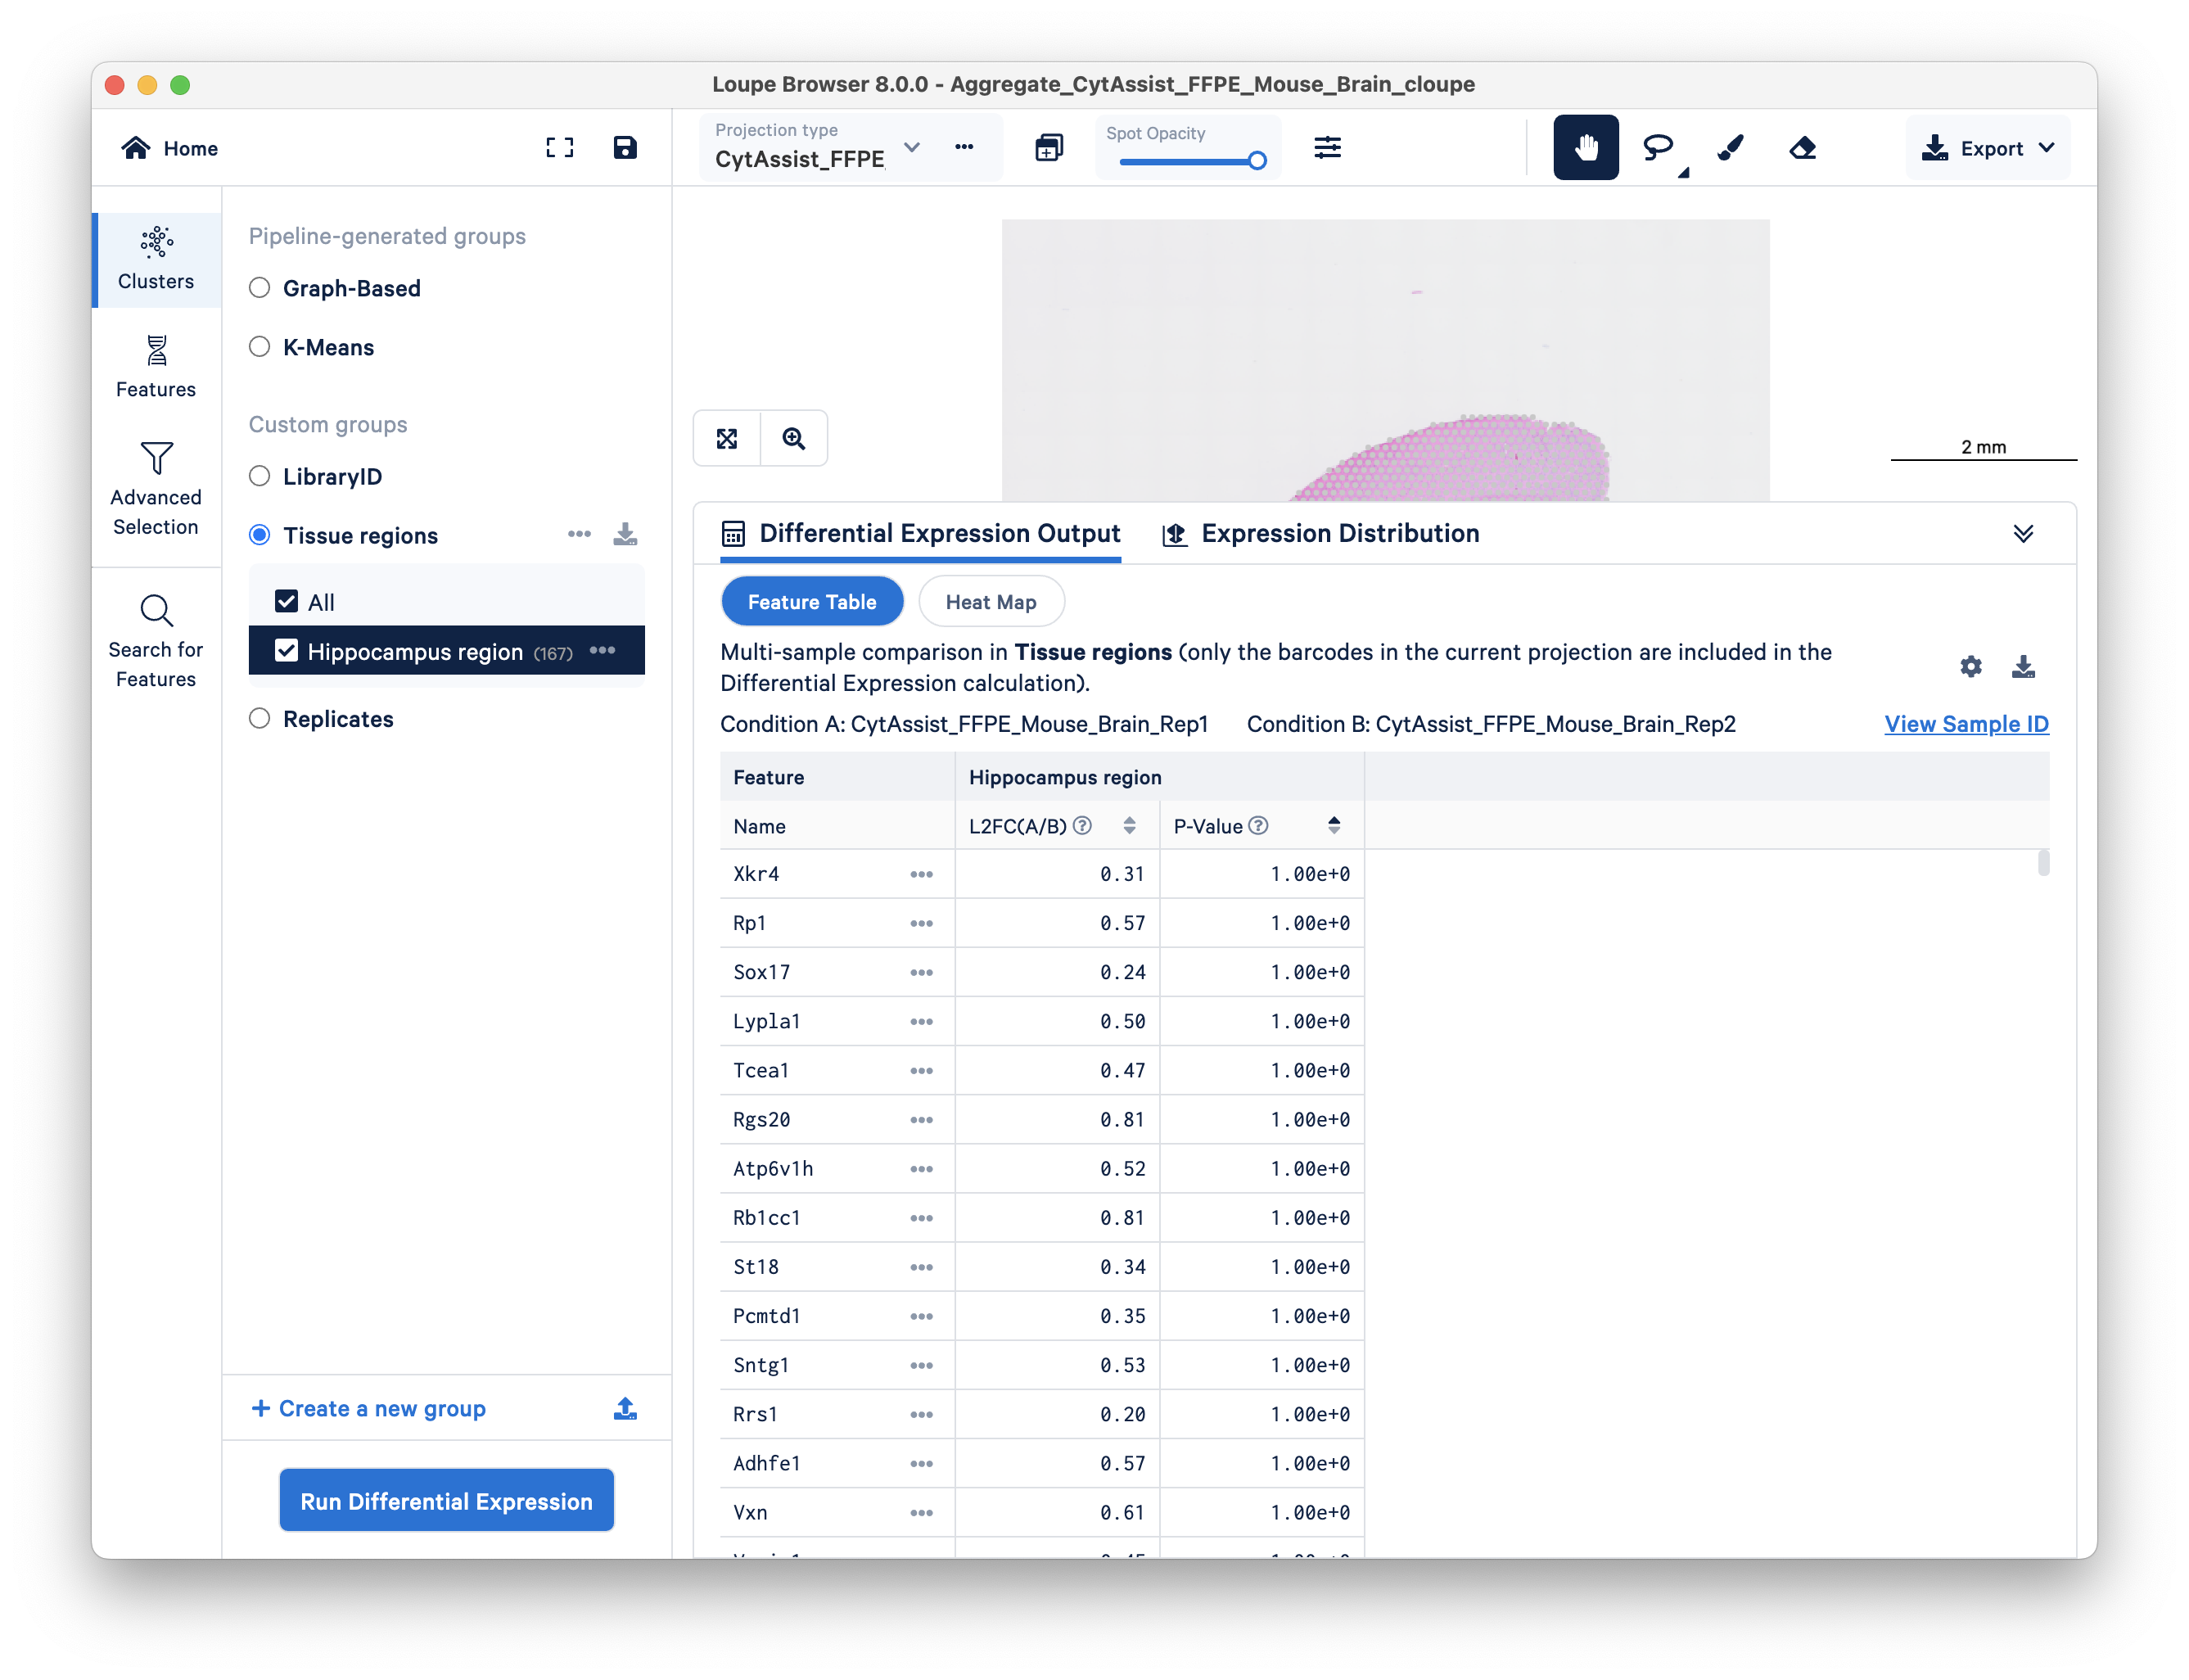
You can now view differentially expressed genes between the hippocampus regions of two technical replicates.
Although this tutorial uses serial sections from the same mouse brain as an example, this workflow is adaptable to different experimental conditions, e.g., treatment and control. If comparing three or more samples, that all tissues need to be assigned to an experimental condition, even if you are not planning to run differential expression on each one.