Human Ovarian Cancer FFPE Single Cell Gene Expression Flex (Next GEM)
Flex dataset analyzed using Cell Ranger 8.0.1
Learn about Chromium Analysis
25 μm formalin-fixed paraffin-embedded (FFPE) curls were sectioned adjacent to sections used for Xenium Prime. Another 25 μm FFPE curls were collected after Xenium Prime sections and pooled together for a total of 50 μm FFPE tissue. Sample preparation was conducted according to Sample Preparation from FFPE Tissue Sections for Chromium Fixed RNA Profiling (CG00632). Approximately 16,500 cells were loaded into GEM wells (targeting 10,000 recovered cells) on a single Chromium X chip. Sequencing libraries were generated following the Chromium Fixed RNA Profiling Reagent Kits for Singleplexed Samples User Guide (CG000691).
Libraries were sequenced on an Illumina NovaSeq 6000 (reagent kit: S4 200 cycles v1.5; loading concentration: 150 nM) with paired-end dual-indexing. The sequencing configuration used:
- 28 cycles Read 1
- 10 cycles i7
- 10 cycles i5
- 90 cycles Read 2
Sequencing libraries were demultiplexed with bcl2fastq (Illumina).
FASTQ files were processed with Cell Ranger v8.0.1 (10x Genomics) using the cellranger multi pipeline and the GRCh38-2020-A reference.
Biomaterials and Pathology
FFPE tissue blocks were purchased from Discovery Life Sciences. Ovarian Papillary Serous Carcinoma: III-B (T3b N0 MX)
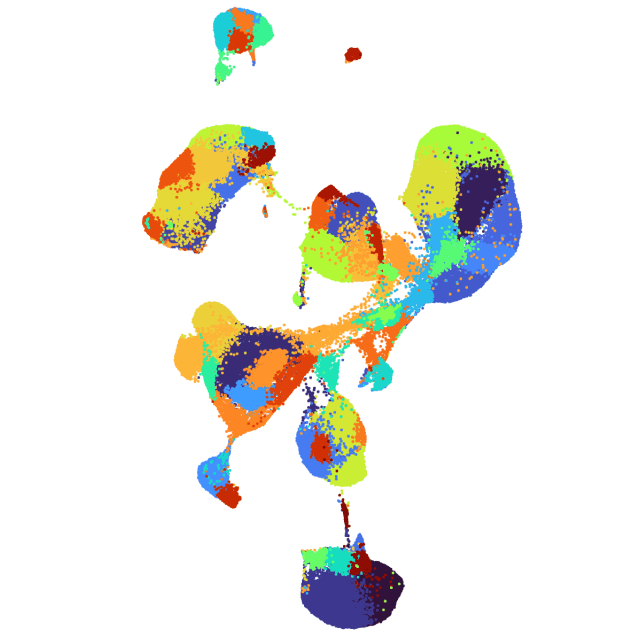
Custom Cell Clustering Ovarian Cancer
Data was imported into Seurat v5.0.1.9007. Using the FindClusters function (resolution = 0.6), 15 cell clusters were identified. Most cell types were annotated using Enrichr and the Human Protein Atlas. Some cell types labeled as "tumor-associated" or "stromal-associated" were annotated based on their spatial distribution in the matched Xenium data. One cluster of tumor-associated fibroblasts was subclustered to identify malignant cells lining an ovarian cyst, as determined by pathologist annotation and matched Xenium data. Another cluster of tumor cells was subclustered to reveal inflammatory tumor cells. A spreadsheet with cell type annotations is available for download.
This dataset is licensed under the Creative Commons Attribution 4.0 International (CC BY 4.0) license. 10x citation guidelines available here.