Slide Preparation and Tissue Optimization: 4 Pro-Tips from Experts on the Visium Spatial Gene Expression Solution (Part 1)
We recently announced our Visium Spatial Gene Expression Scientific Challenge Winner! For his proposal to map human myocardial infarction, Christoph Kuppe, a physician-scientist in the laboratory of Rafael Kramann at Germany’s RWTH Aachen University, won a complete spatial gene expression experiment performed by members of the R&D team at 10x Genomics headquarters.
Dr. Kuppe is interested in exploring cardiac tissue remodelling, including inflammation and scar formation following a myocardial infarction (MI), commonly known as a heart attack. To learn more about his research goals, read our blog post.
After winning the challenge, Dr. Kuppe provided several tissue samples to the 10x Team. We followed this tissue as it progressed through each step of the Visium Spatial Gene Expression Solution workflow, noting some best practices and expert tips from the same 10x Genomics scientists who developed the workflow.
Sectioning
Cedric Uytingco, Scientist at 10x Genomics, sectioned heart tissue for the initial Tissue Optimization steps of the Visium Spatial Gene Expression Solution workflow. He matched the orientation of the tissue contained within a frozen block of OCT to that of an image provided by the Kramman Lab. He then mounted the heart tissue within the cryostat.
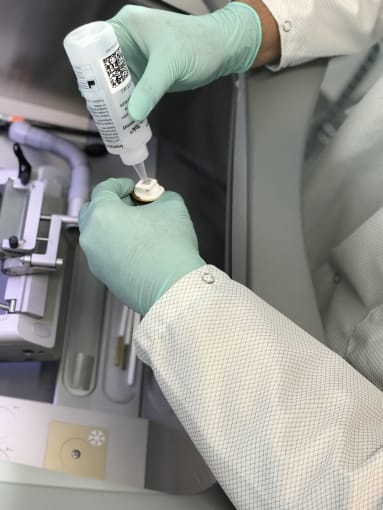
He explained that he needed some representative sections for the tissue optimization step. That is, sections of the tissue that are most like the target sections for the spatial gene expression experiment. He removed the mounting wheel and demonstrated an expert tip:
Pro-Tip #1: To avoid cutting into the tissue during these initial slices, layer a small amount of OCT on the top of your sample and allow it to freeze. This allows you to make small adjustments to optimize sectioning orientation prior to taking tissue sections.
Cedric began taking sections, gingerly stamping the slide down onto the slices. Following this step, he demonstrated two more expert tips:
Pro-Tip #2: When taking sections for the spatial gene expression slides, it is important to mount sections within the square fiducial border. Fiducials orient the section spatially, and enable the Space Ranger data analysis pipeline to properly detect barcoded spots within the tissue.
Pro-Tip #3: Melt the remaining OCT by putting your finger on the back of the slide, behind each section of tissue. Then set the slide down within the cold machine, and refreeze the tissue.
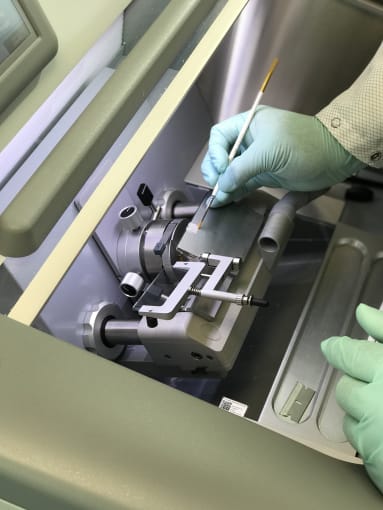
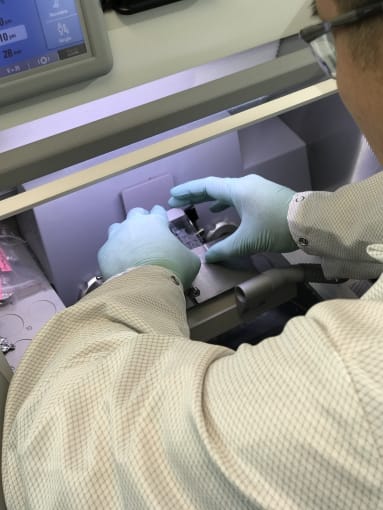
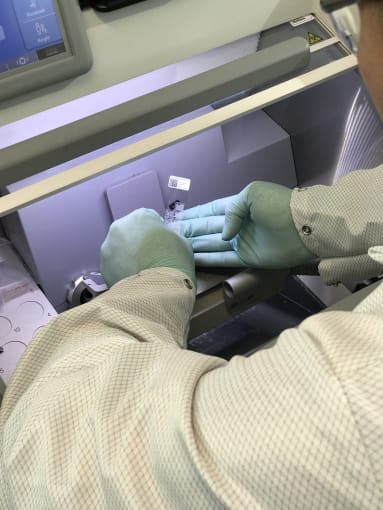
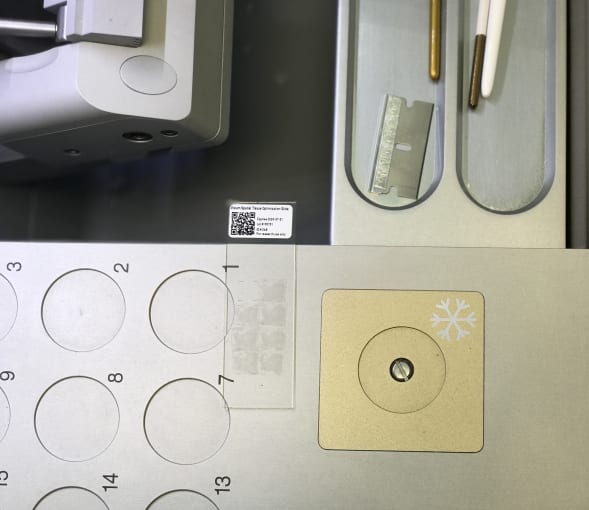
Cedric explained that tissue optimization is a necessary step in the Visium Spatial Gene Expression Solution workflow because it determines how long you will permeabilize your samples to release mRNA. Between healthy controls and diseased tissue, there may be different optimal permeabilization times. Thus these preliminary steps would allow us to determine permeabilization times that would suit both tissue conditions.
Tissue Staining
Later in the afternoon, Jennifer Chew, another 10x Genomics Scientist, performed fixation and staining steps for the tissue optimization slides. After fixing the tissue, she washed the slides with isopropanol. This helps the slides dry faster after each step in the staining process, which is critical for experimental success.
Jennifer then performed the H&E stain, used to color the nuclei, cytoplasm and connective tissue of the heart cells. She removed the excess H&E and rinsed the slides, then she let the slides dry thoroughly on a thermocycler, fitted with a slide mounting apparatus.
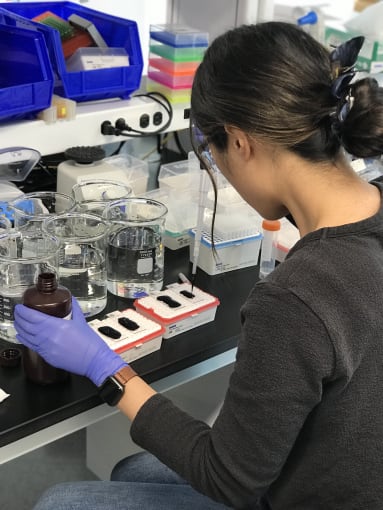
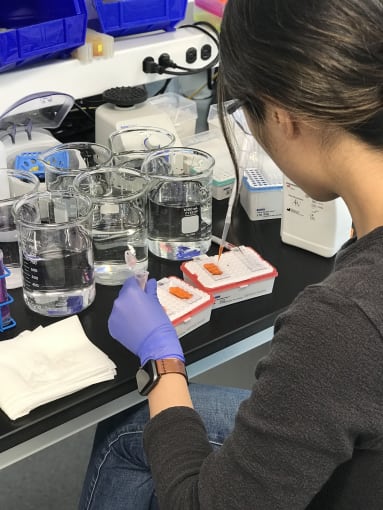
Pro Tip #4: Jen explained that this extra drying step was necessary to ensure no water droplets remained on the tissue optimization slides. Droplets can interfere with imaging the tissue, distorting the light from the microscope as it passes through the water.
Tissue Imaging
In the imaging room, Cedric and Jen placed the slides under a microscope with tile scanning functionality. Images gradually emerged and were then stitched together, leaving a full image of neat rows of heart tissue.
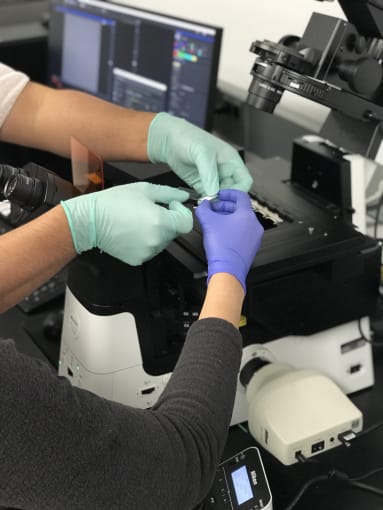
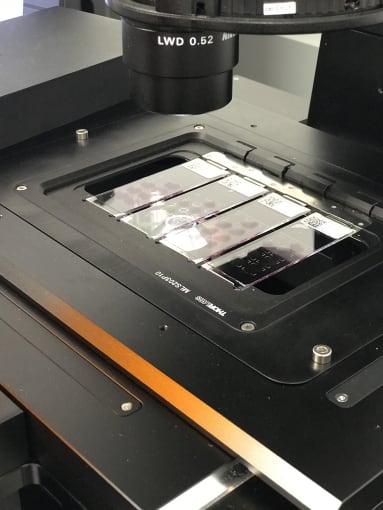
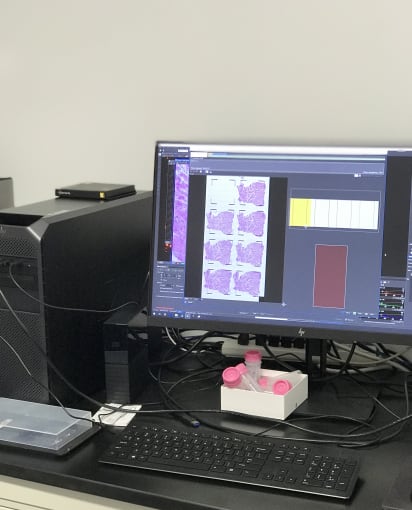
Following imaging, these TO slides underwent an optimization protocol. They were treated for different permeabilization times to assess the optimal fluorescence signal from each condition, which allows you to choose the correct permeabilization times for your library preparation steps.
That’s it for Part 1! Many thanks to Cedric Uytingco and Jennifer Chew for performing this experiment and sharing their tips and experiences with our audience.
We hope this record from the bench can be a helpful resource to you as you begin your own experiments with the Visium Spatial Gene Expression Solution. Stay tuned for Part 2, which will follow permeabilization and cDNA library construction steps on the Visium Spatial Gene Expression slides.
In the meantime, you can explore these additional resources for the Visium Solution:
- How does the Visium Solution work? Read more →
- How do I get started with spatial gene expression experiments, and perform data analysis? View our webinars →
- Looking for the demonstrated protocols? Visit our Support Website →
