Goal: Evaluating image data and clustering in the spatial view.
This tutorial will showcase how to understand clusters spatially, and how to define new clusters based on known gene markers, using a preloaded mouse brain dataset in Loupe Browser.
- Loupe Browser on macOS or Windows
- Familiarity with Loupe Browser navigation
- Access to tutorial dataset
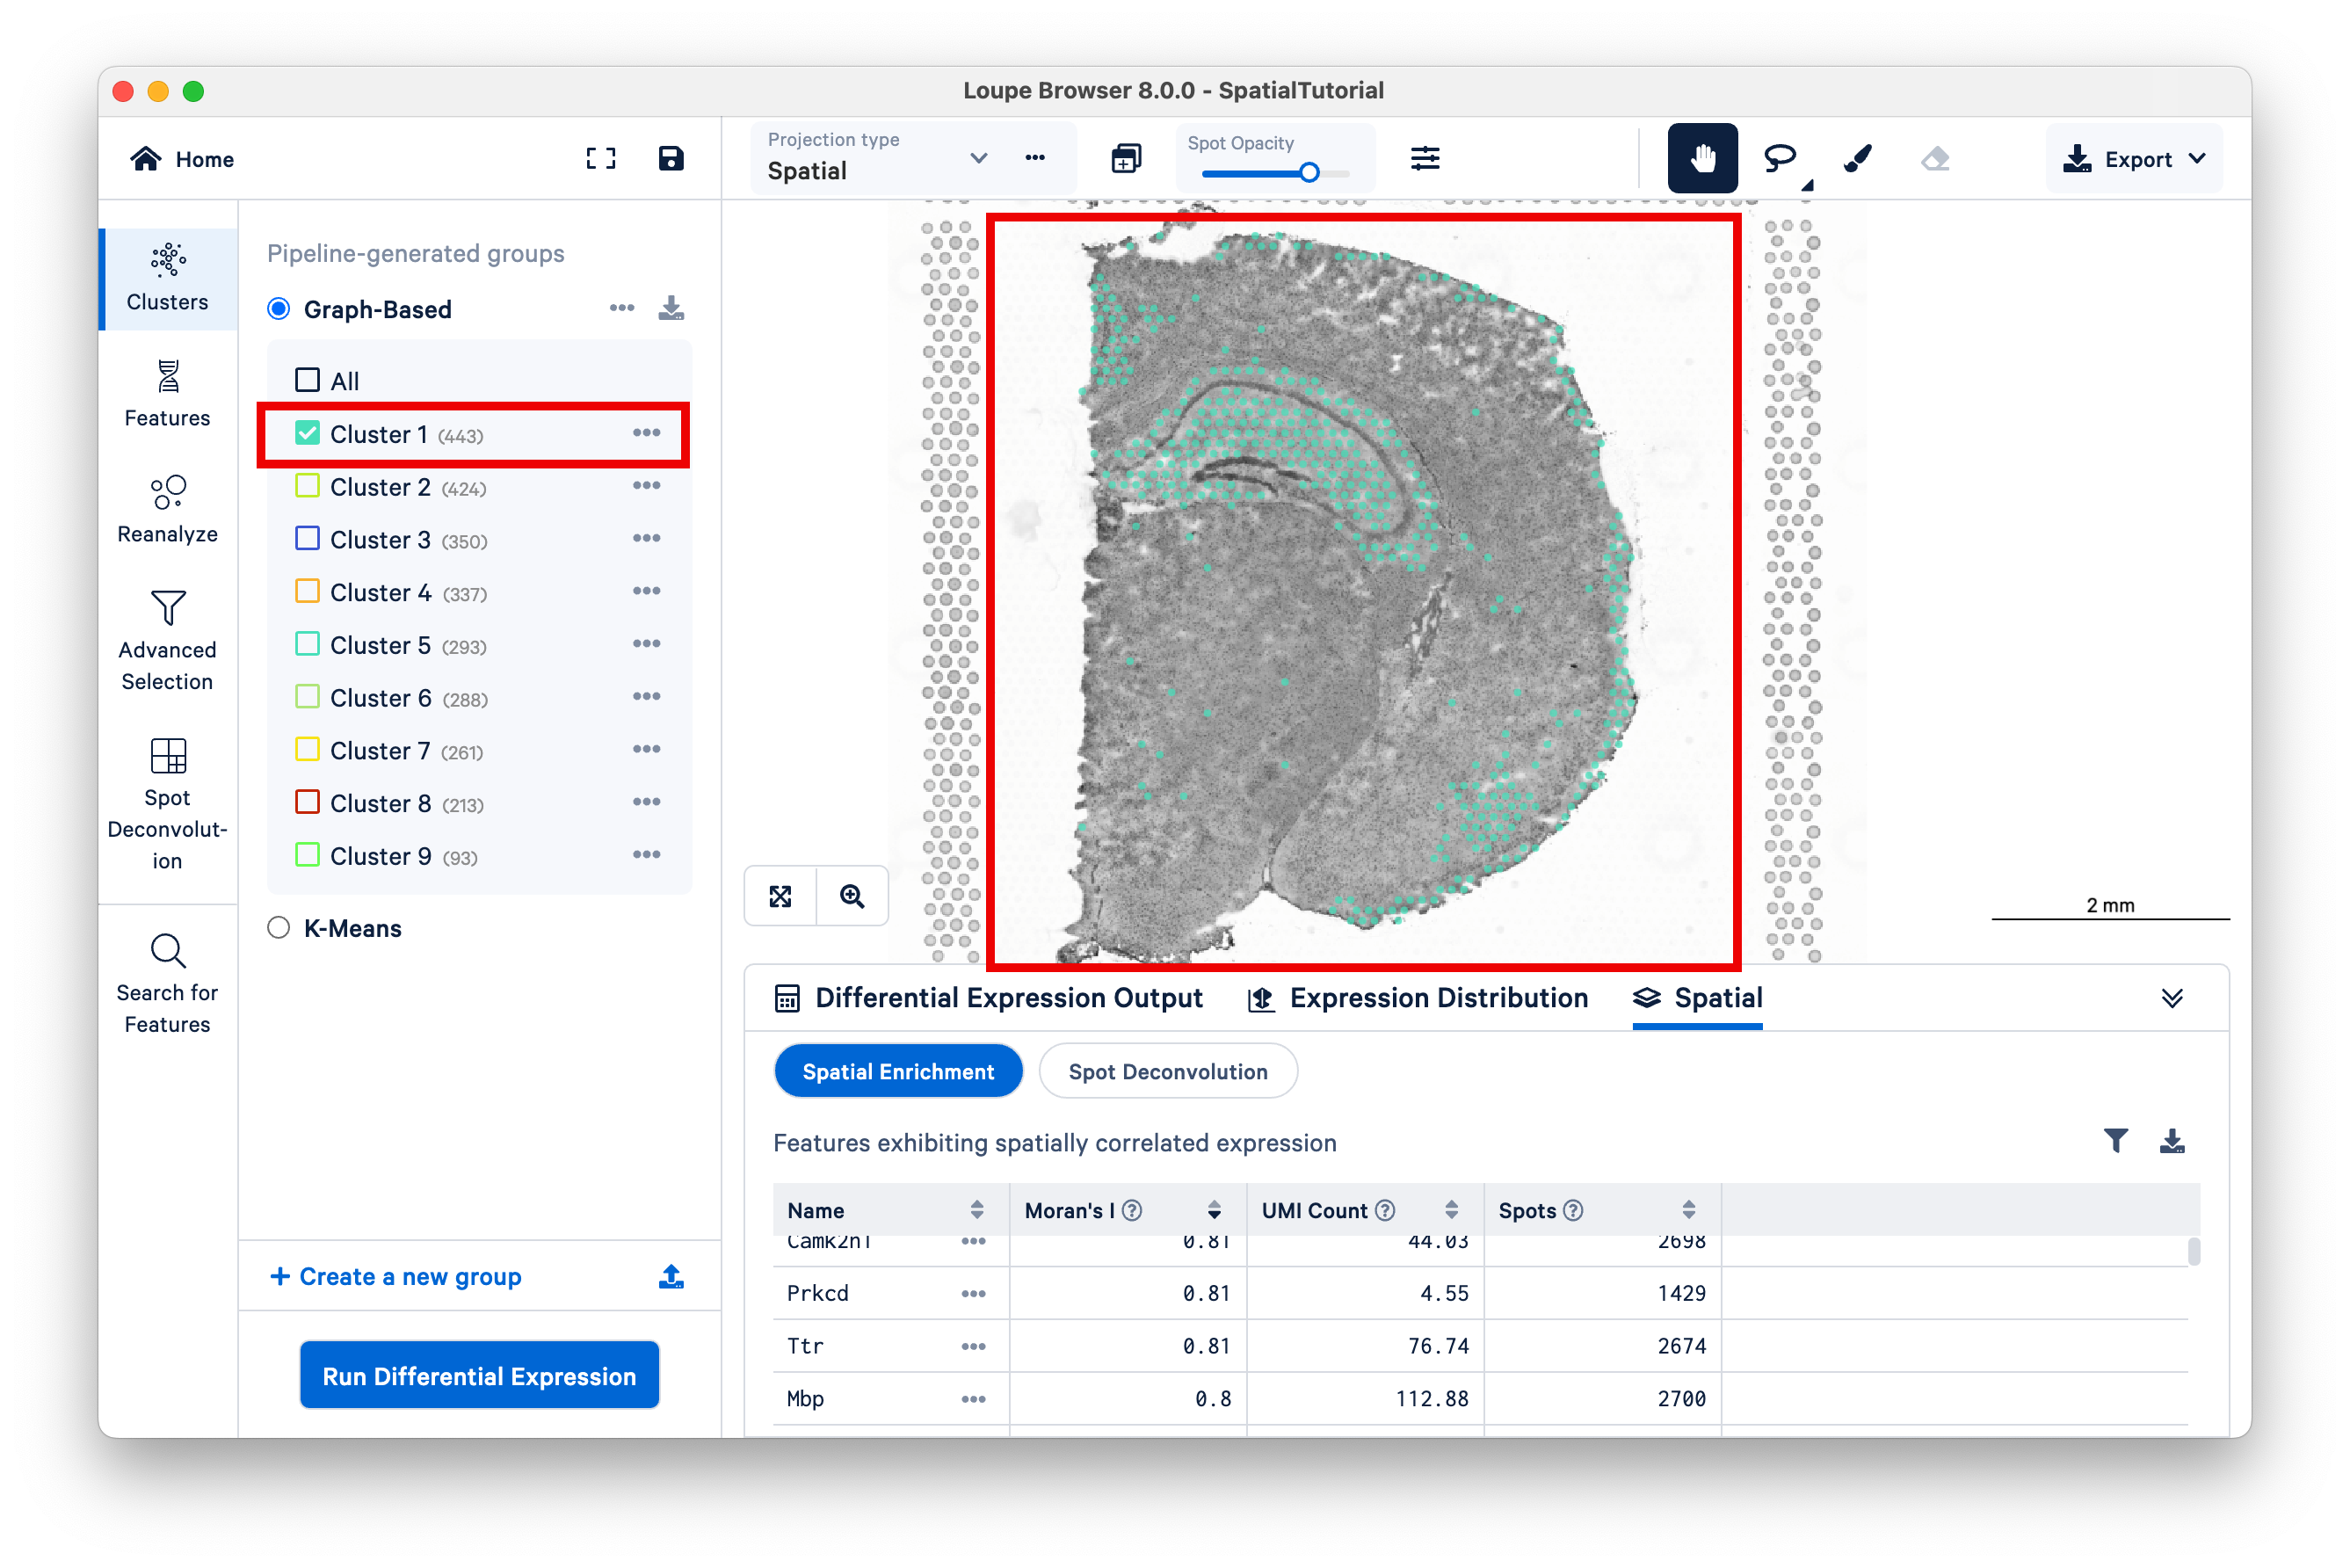
Spots that appear under the tissue are assigned to clusters by Space Ranger and are determined using only gene expression information, without any spatial information from the image. Since each spot underneath the tissue is associated with a cluster, the clustering can be visualized in a spatial context.
First, we will update the color assigned to some clusters for better distinction from the tissue image. Click the three horizontal dots next to the cluster and select Edit Color. Here are the HEX color codes used in this tutorial:
- Cluster 5: 50E3C2
- Cluster 6: B8E986
- Cluster 7: F8E71C

In this view, take a closer look at Cluster 1. It consists of a discontinuous selection of spots. This cluster contains the hippocampus and part of the isocortex.
While Loupe Browser provides visualization of clusters determined by Space Ranger, it is possible to define your own clusters based on gene markers. In this tutorial, we will import a list of gene markers that correspond to subfields of the hippocampus.
Click here to download list of genes that correspond to the CA1, CA2, and CA3 regions of the hippocampus. This file contains the following genes:
- Fibcd1
- Cacng5
- Cldn22
Note that the gene names must match with the ones included in the annotation reference provided to spaceranger count. To import the CSV file into Loupe Browser, click the Upload icon on the bottom left:

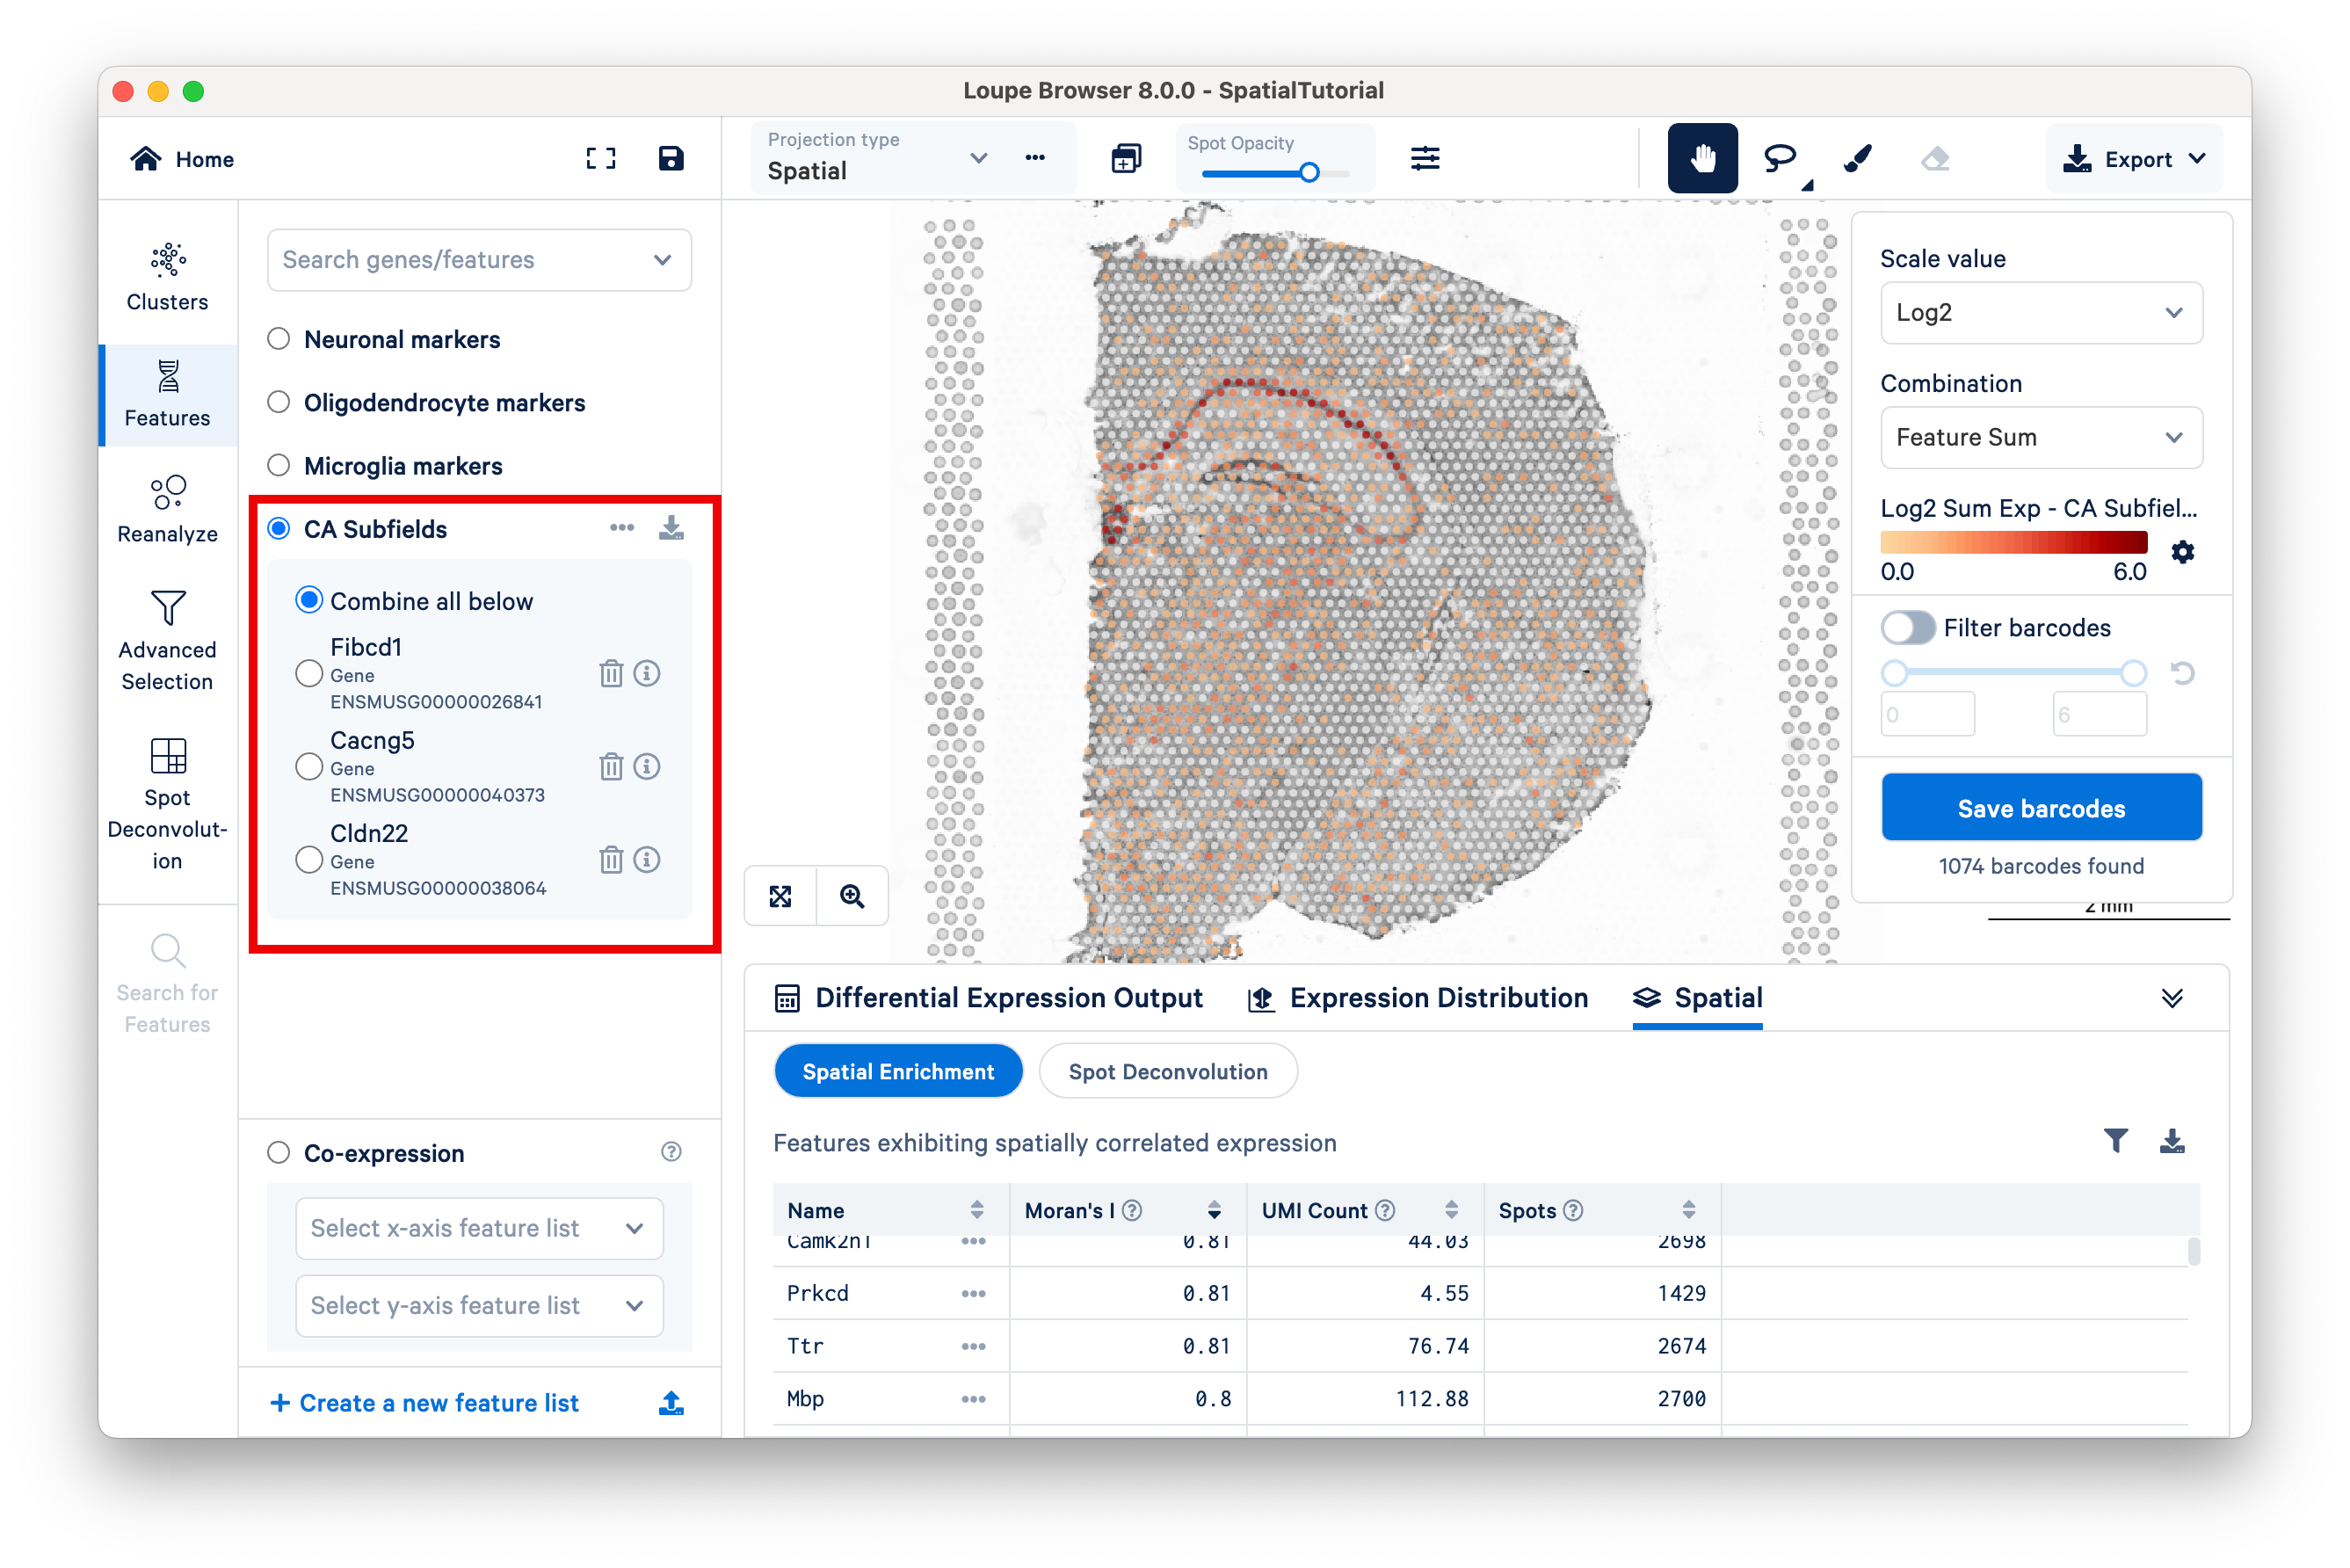
After it is imported, a new gene list called CA Subfields will be visible, with the three hippocampal gene markers in the list.
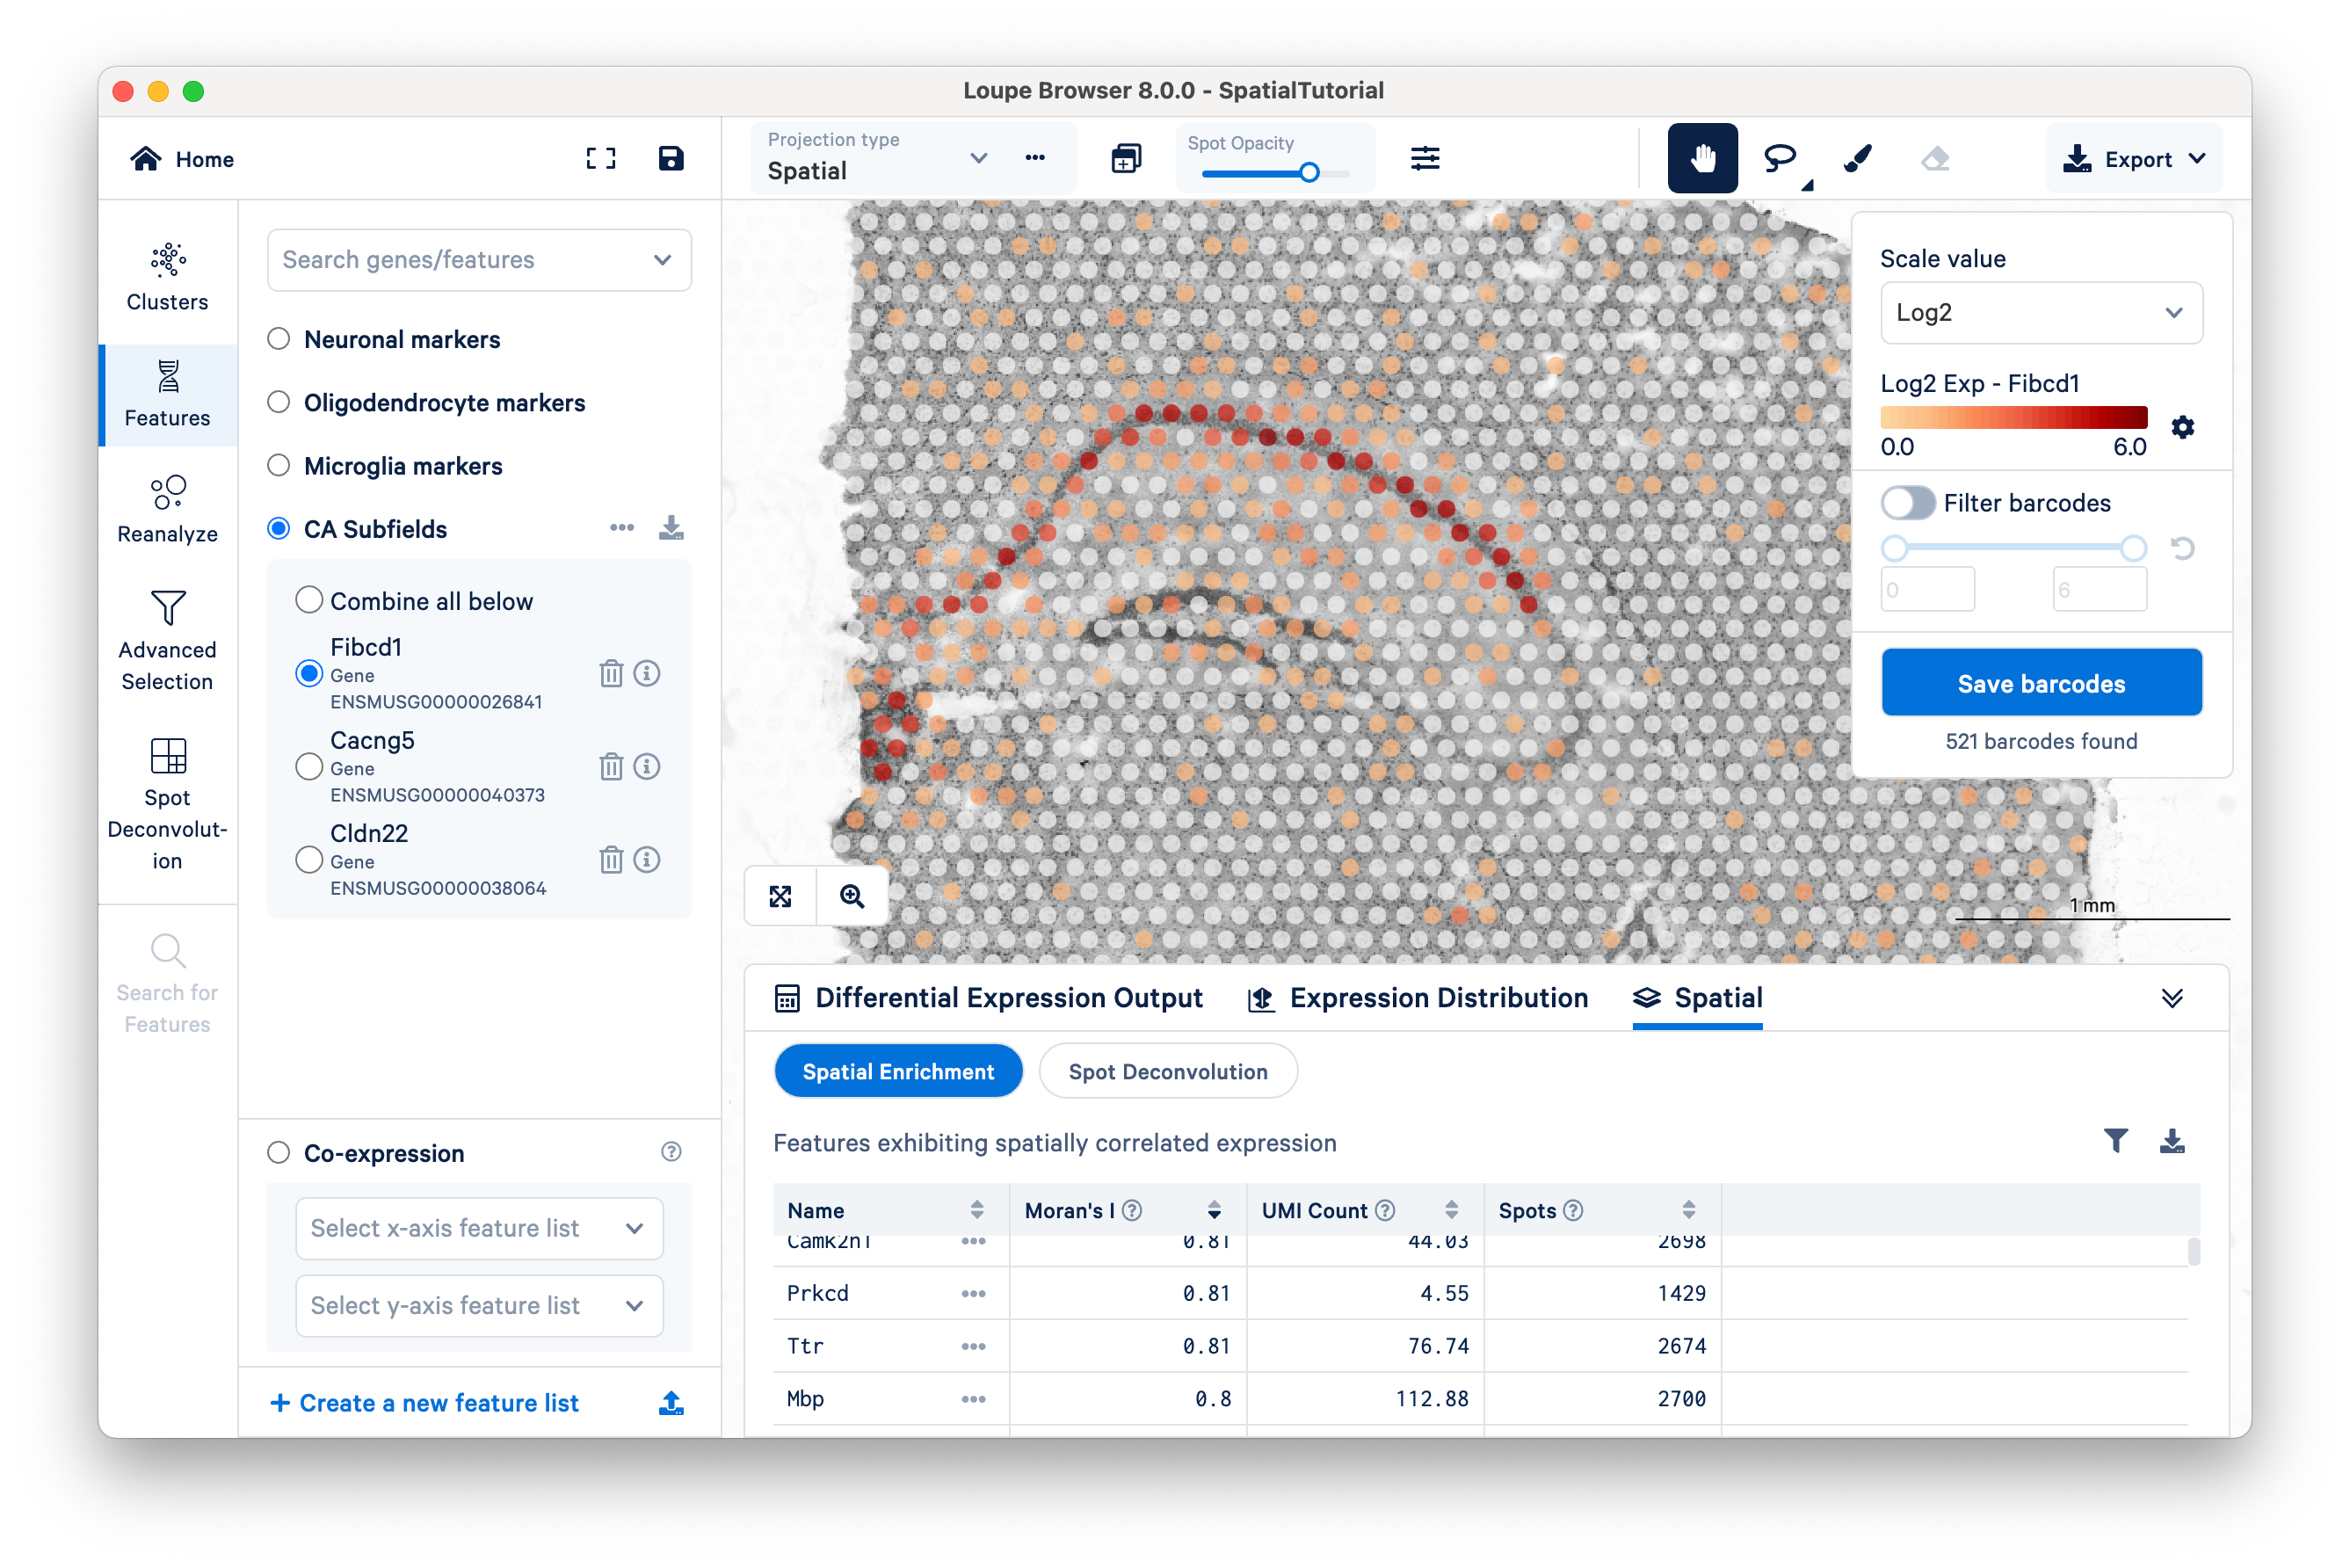
The gene Fibcd1 is a marker for CA1 subfield of the hippocampus. Click on Fibcd1 to see its expression. The dark red spots correspond to high expression for this gene. Fibcd1 is concentrated in the CA1 region and the habenula.
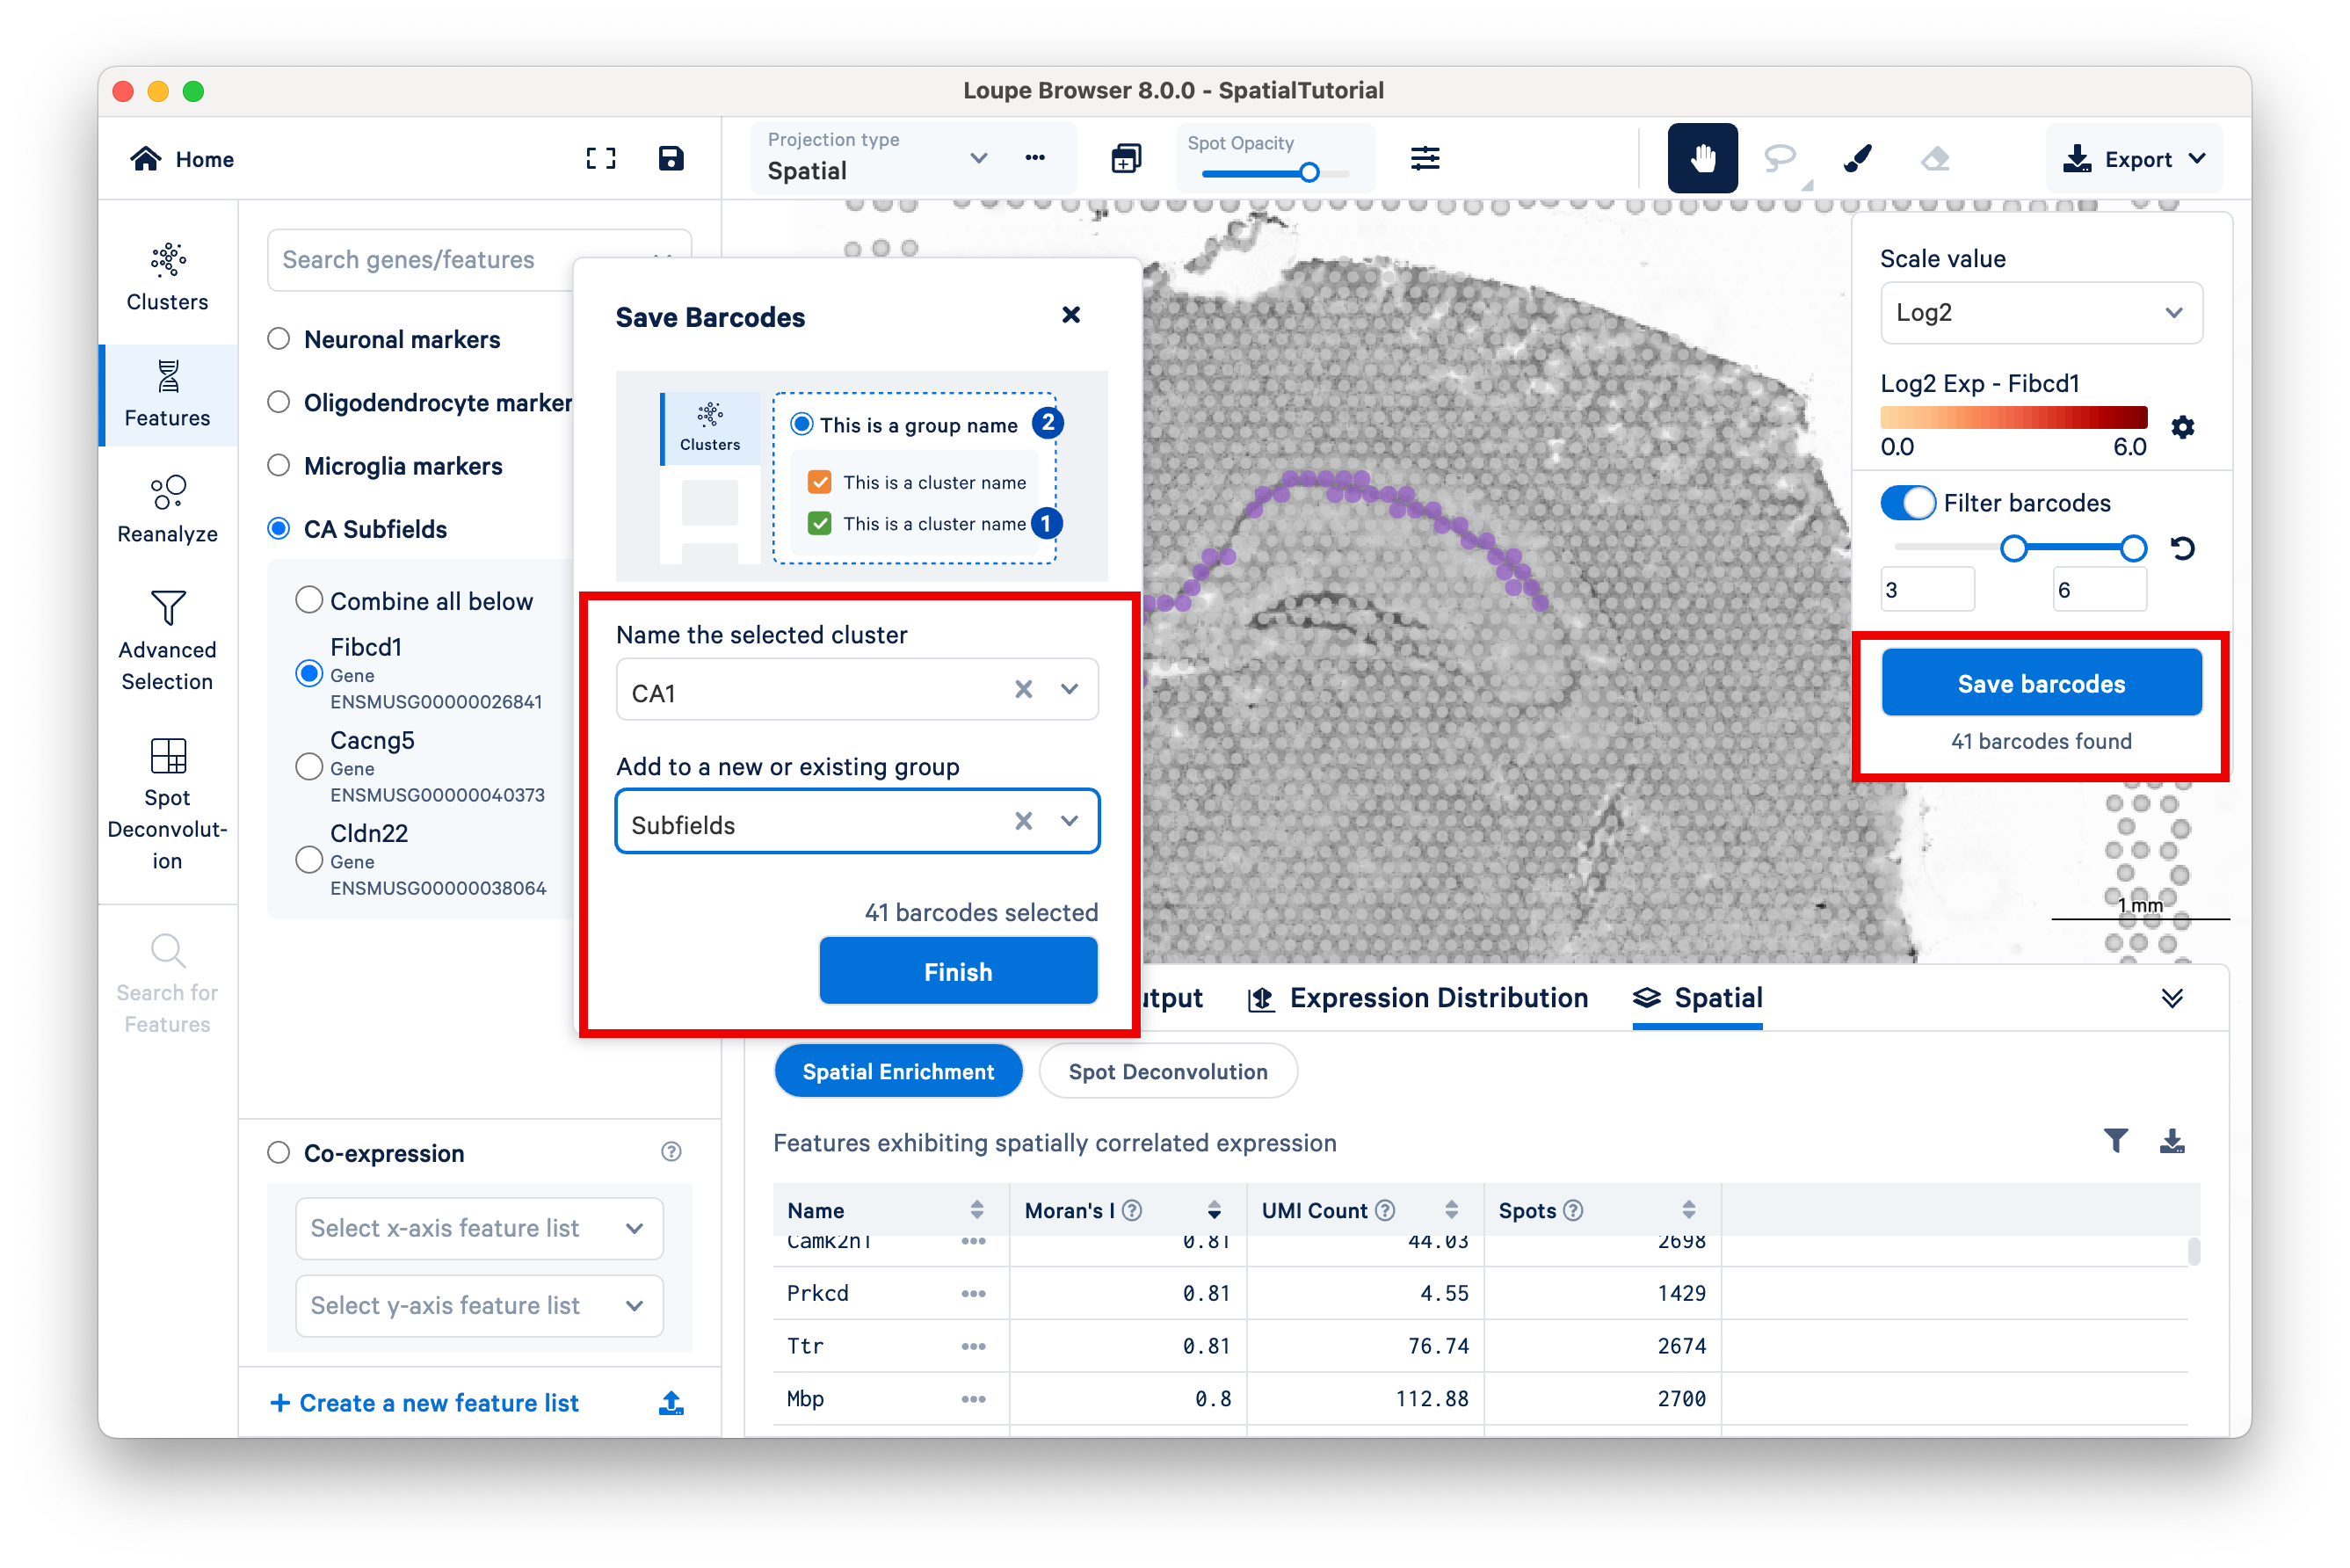
The first step to creating the CA1 cluster is to filter spots to retain only those with high expression of Fibcd1. Click Filter Barcodes and choose a range of 3 to 6. This threshold was chosen as it represents the midpoint in the range for log 2 expression value. You should see 41 spots (barcodes) selected.

Click Save Barcodes. This gives us the option to create a new cluster that contains only those 41 spots. You can create a new Group name called Subfields and a new Cluster name called CA1. Then click Finish.
The Subfields category is now displayed, along with the new cluster, CA1. You may wish to change the color to make the spots stand out more.
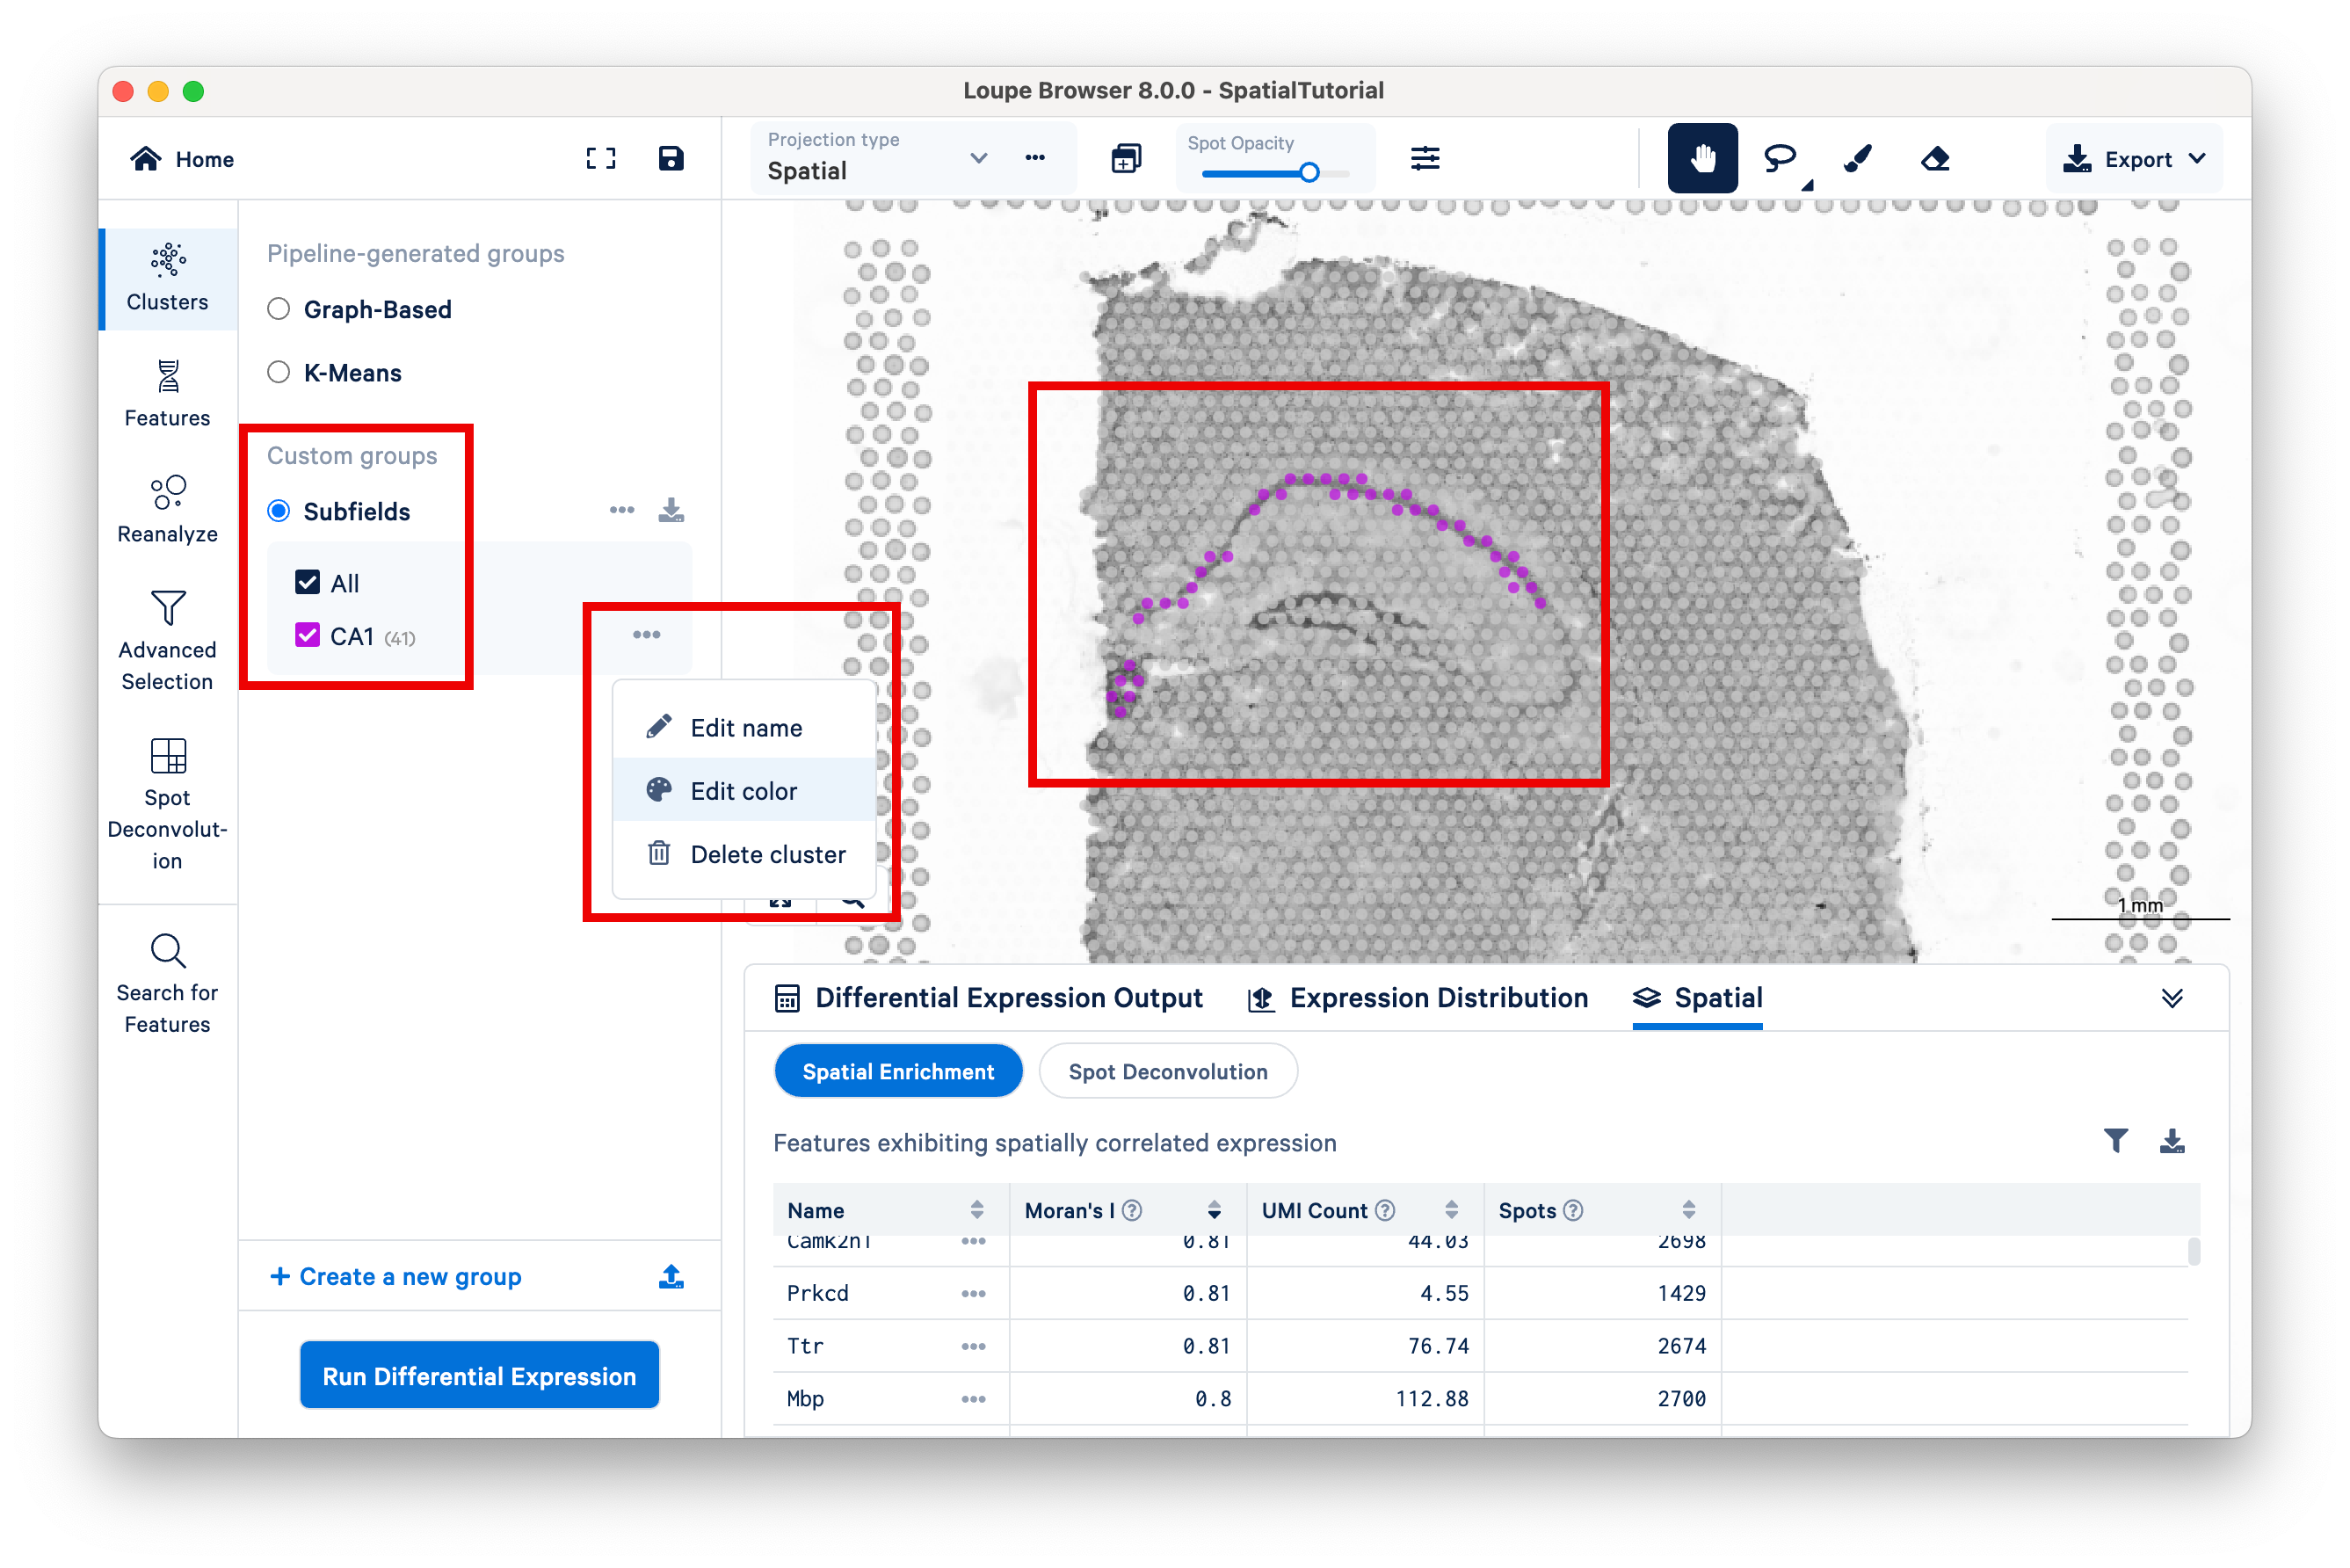
To isolate the CA1 region, you can remove the spots that are associated with the habenula. To do this, use the Clear Selection tool.
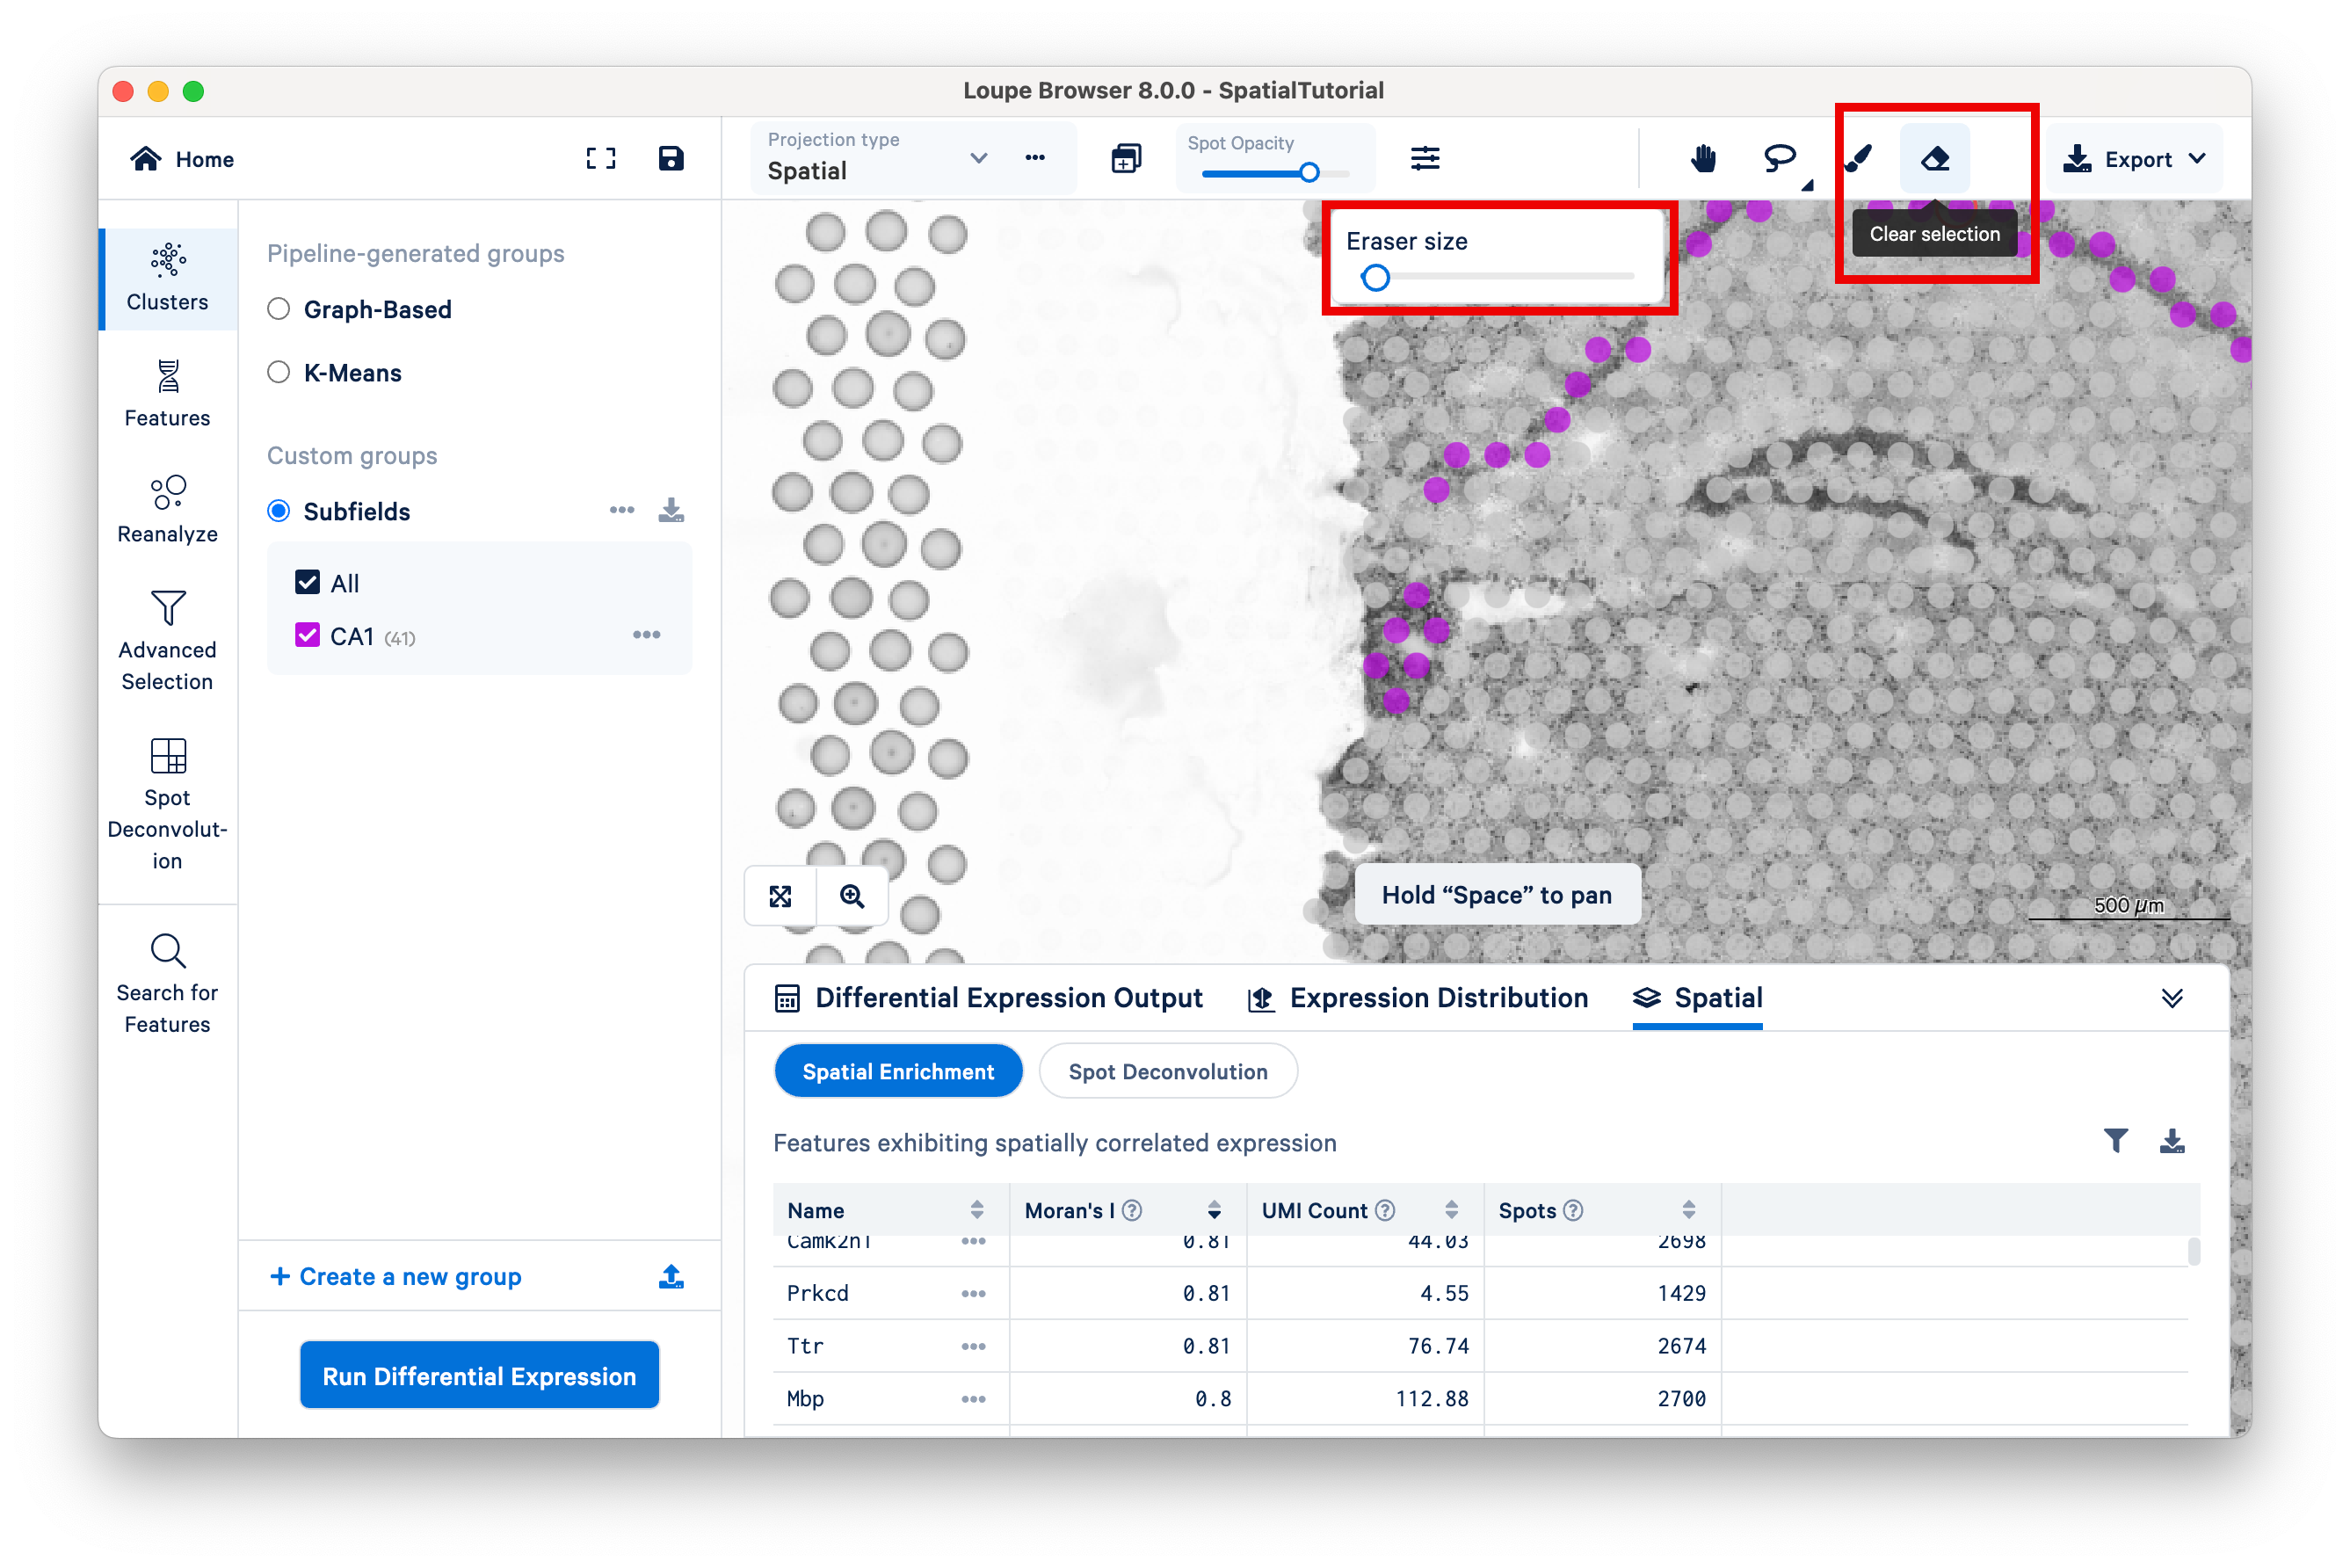
It helps to zoom in and set the eraser size to be small.
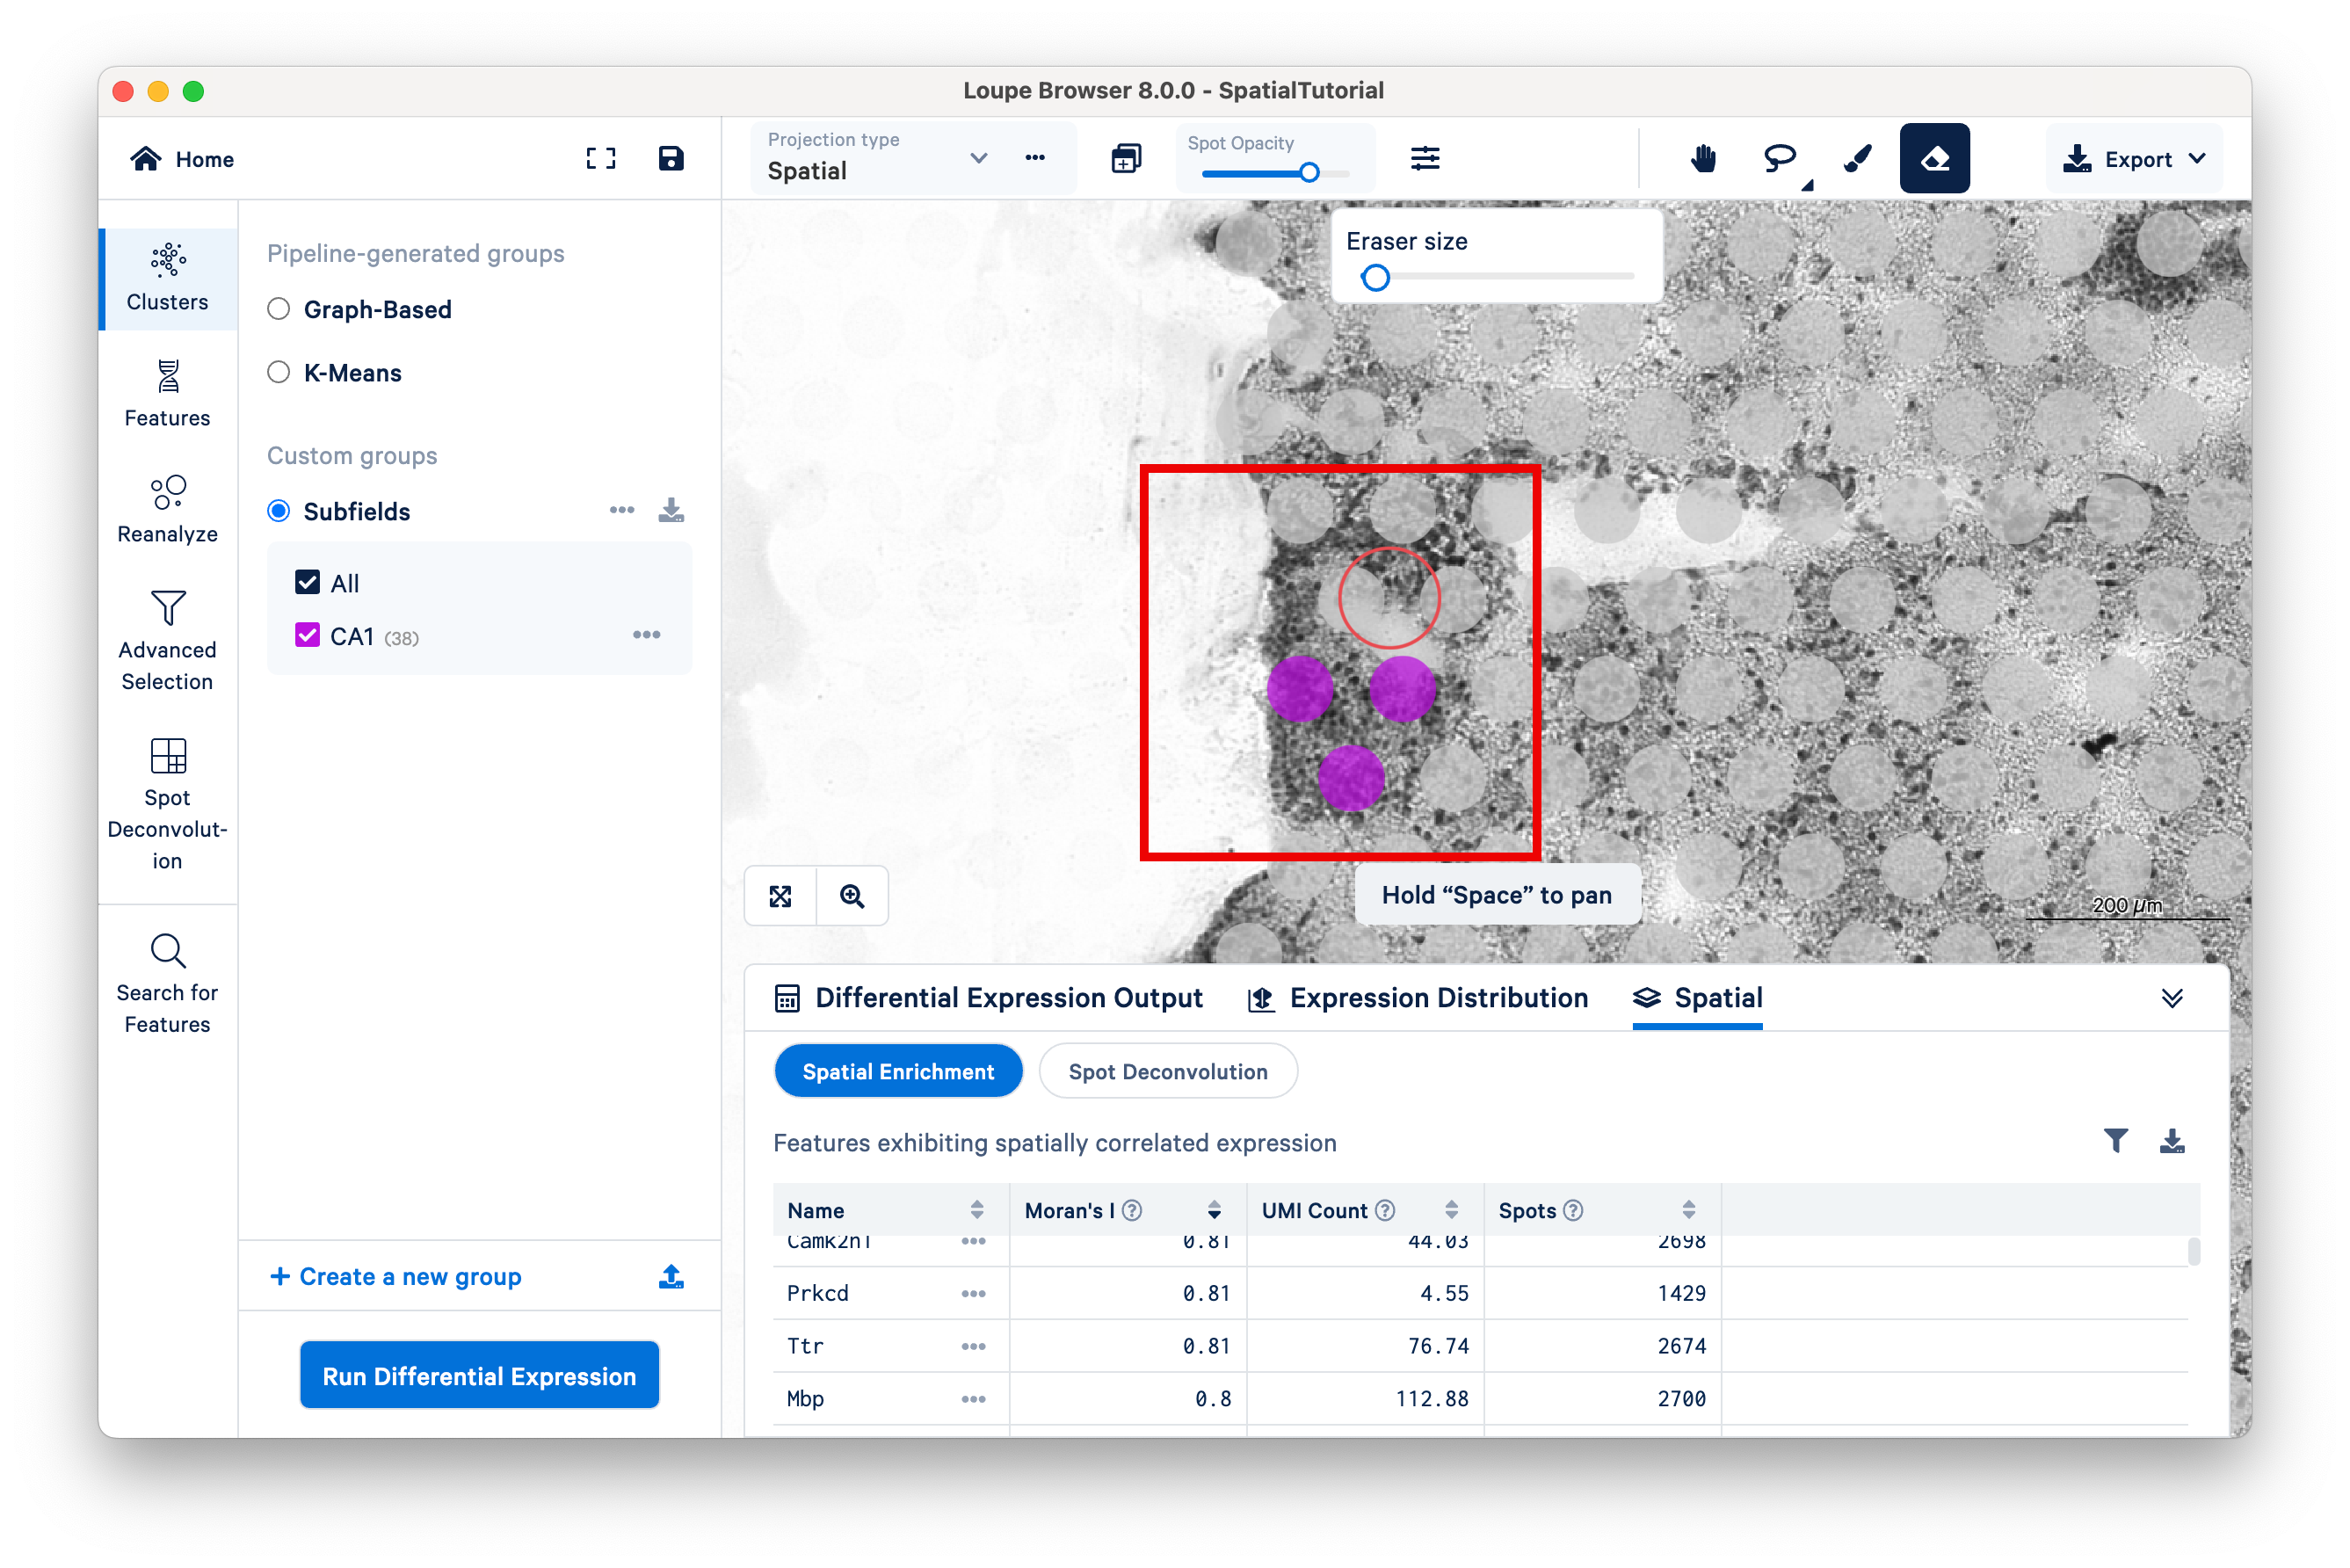
The remaining spots in the cluster (35) now correspond to only the CA1 region of the hippocampus.
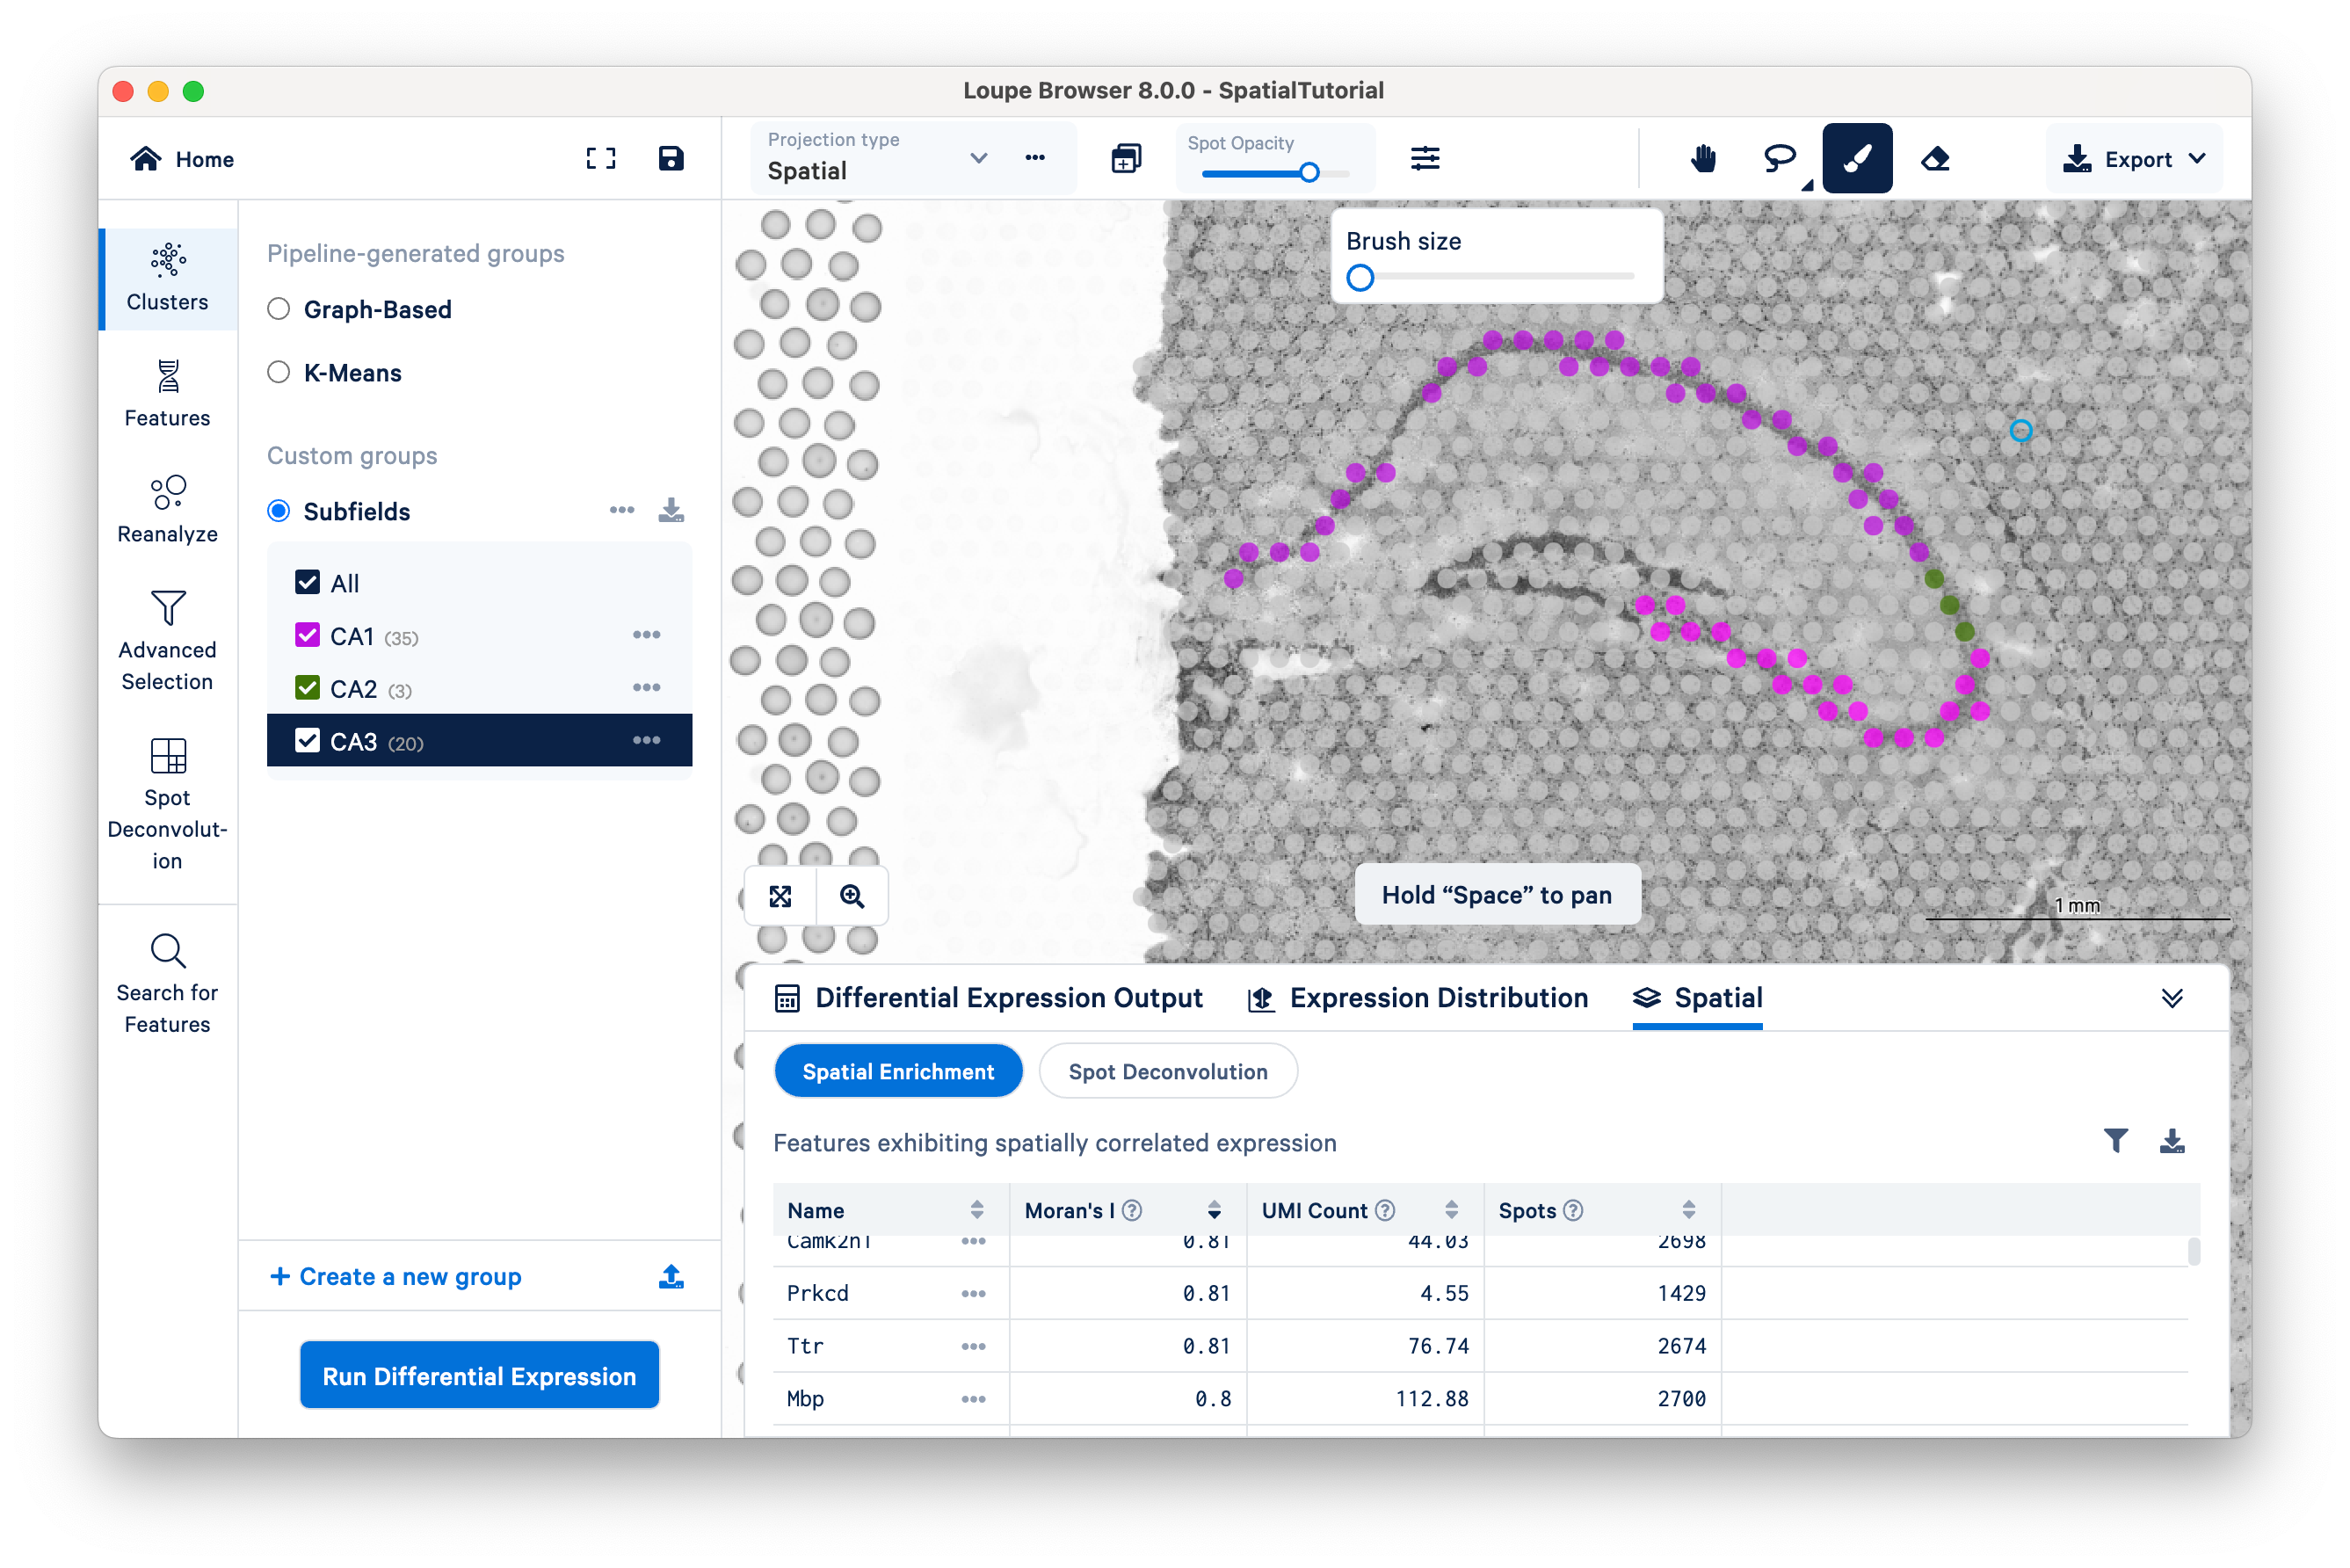
Now create clusters for Cacng5 (CA2 subfield) and Cldn22 (CA3 subfield). Since the spots associated with these genes are more spread out, it may be easier to select them using the Draw Selection or Freehand Selection tools. The end result should look similar to this:
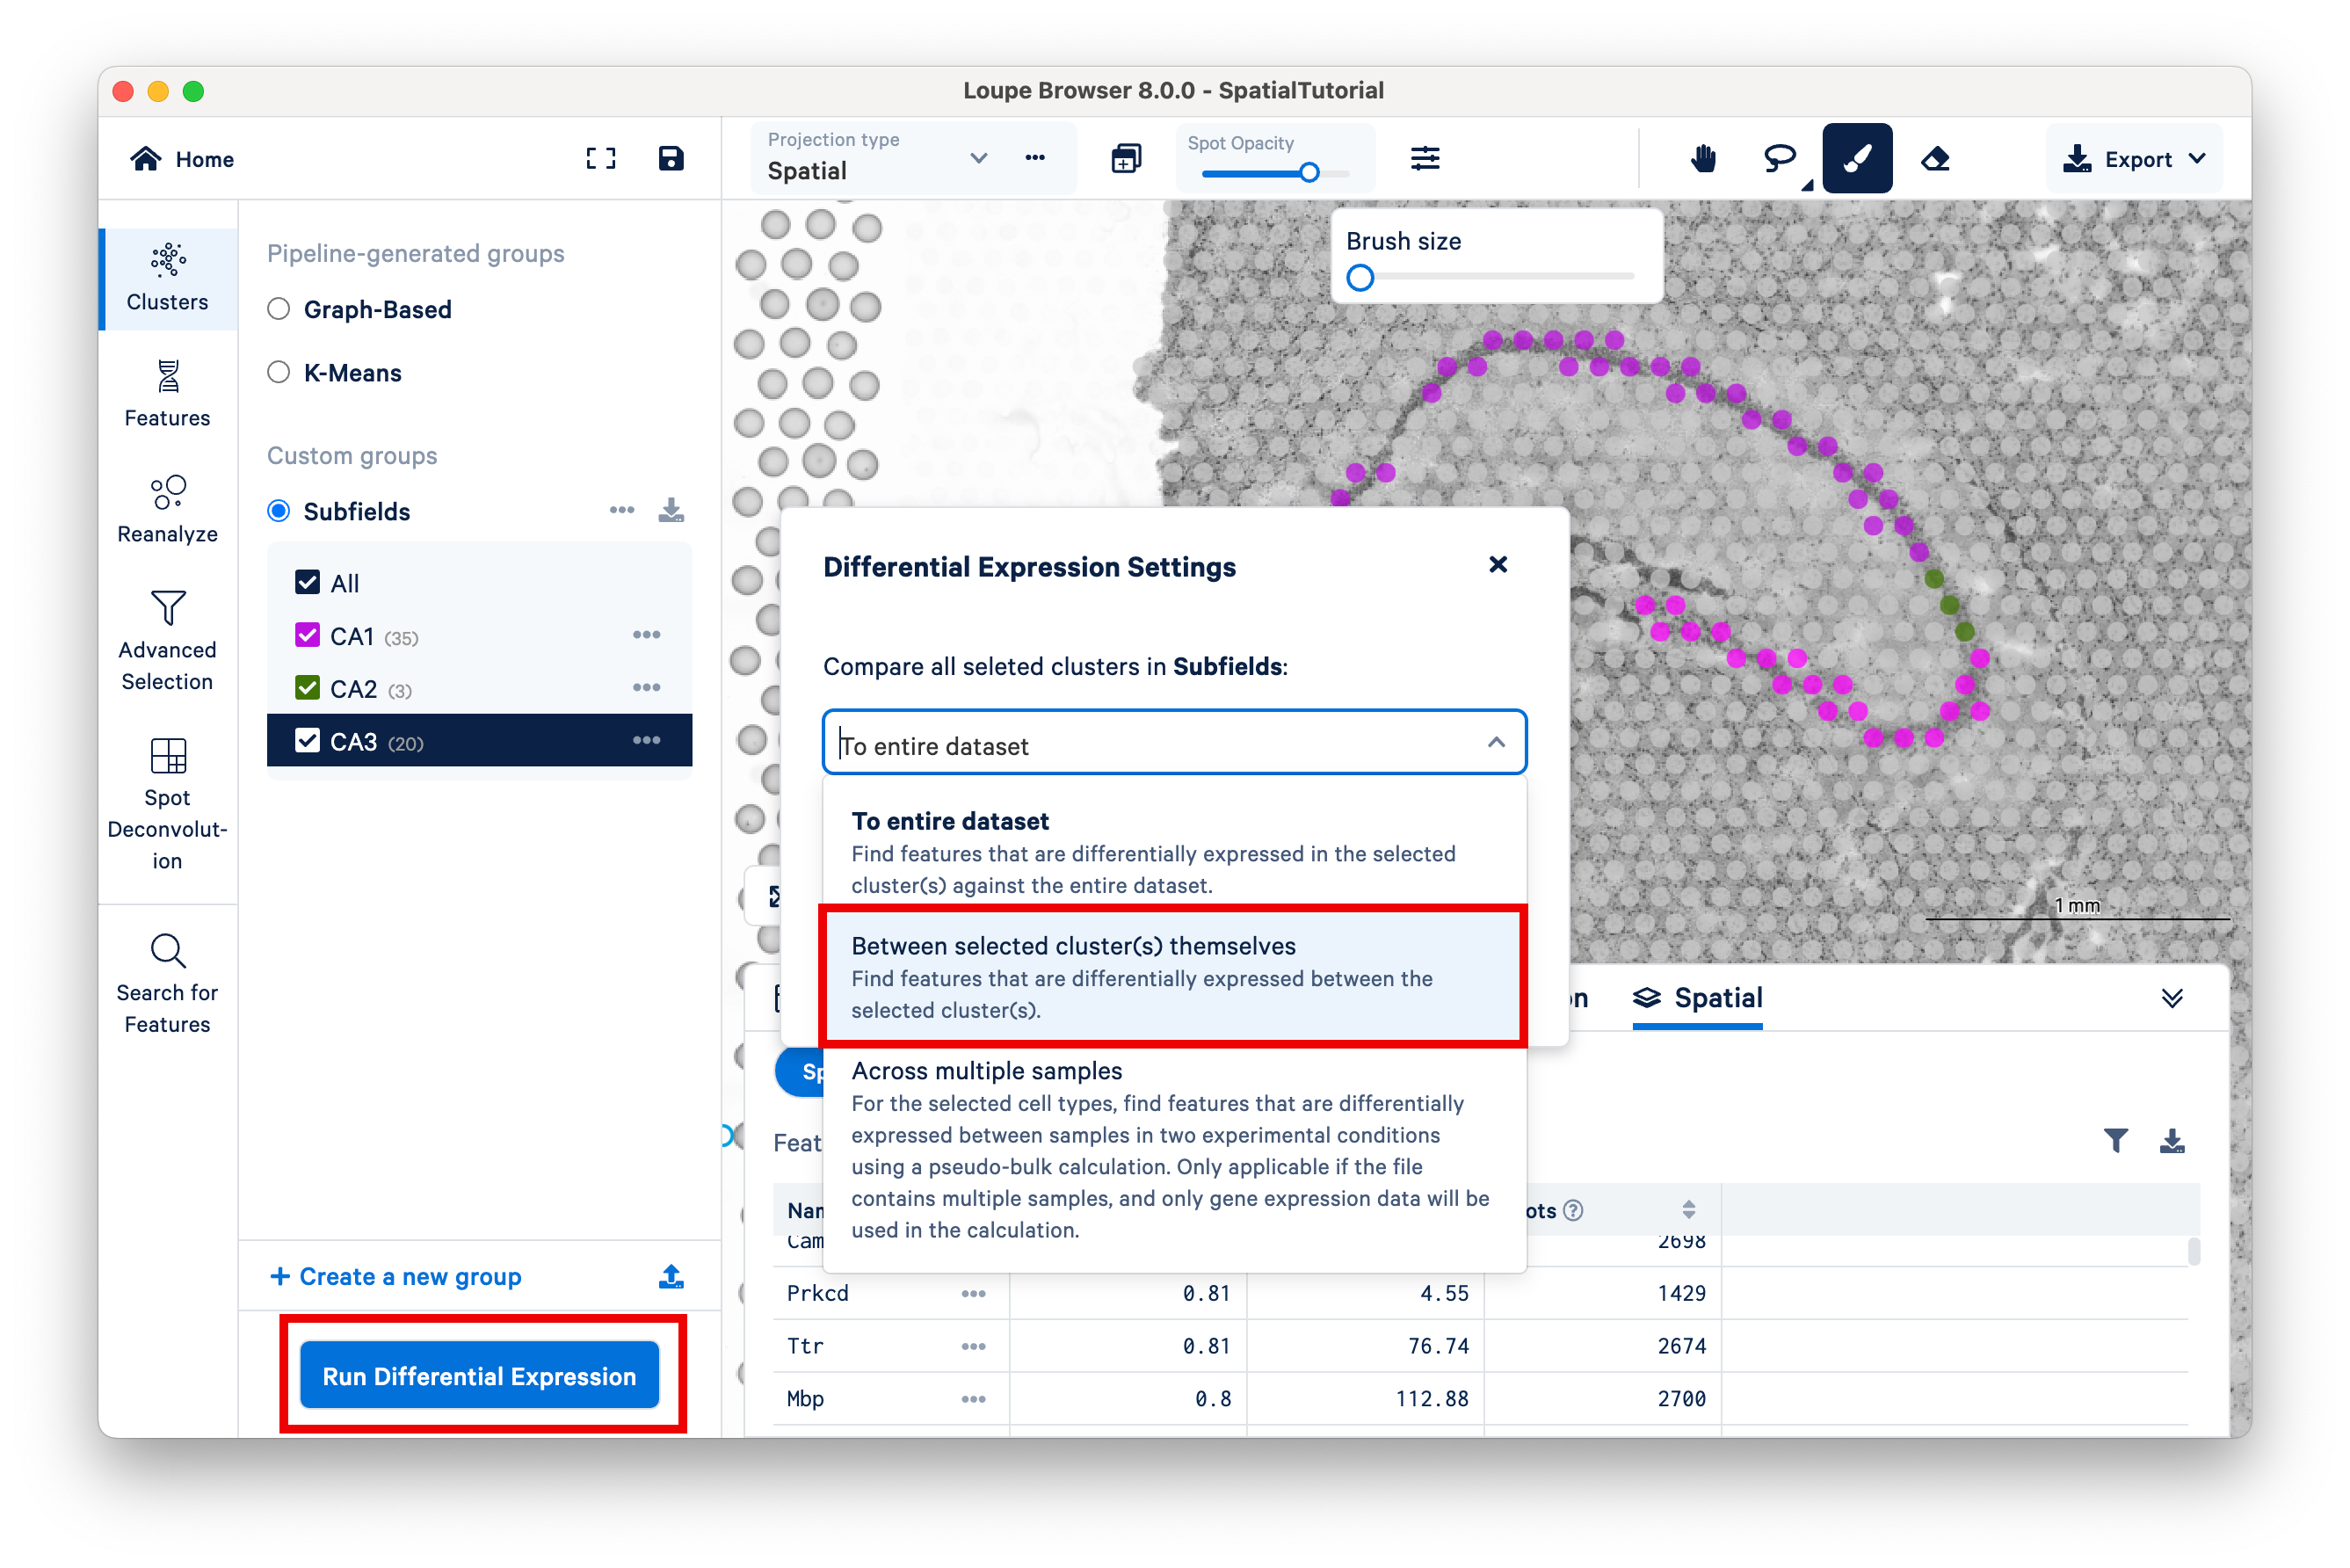
Loupe Browser provides the capability to calculate new statistically significant genes for pre-loaded or user-defined categories. Click Run Differential Expression to begin, then select the second option, to compare gene expression between the selected clusters themselves.
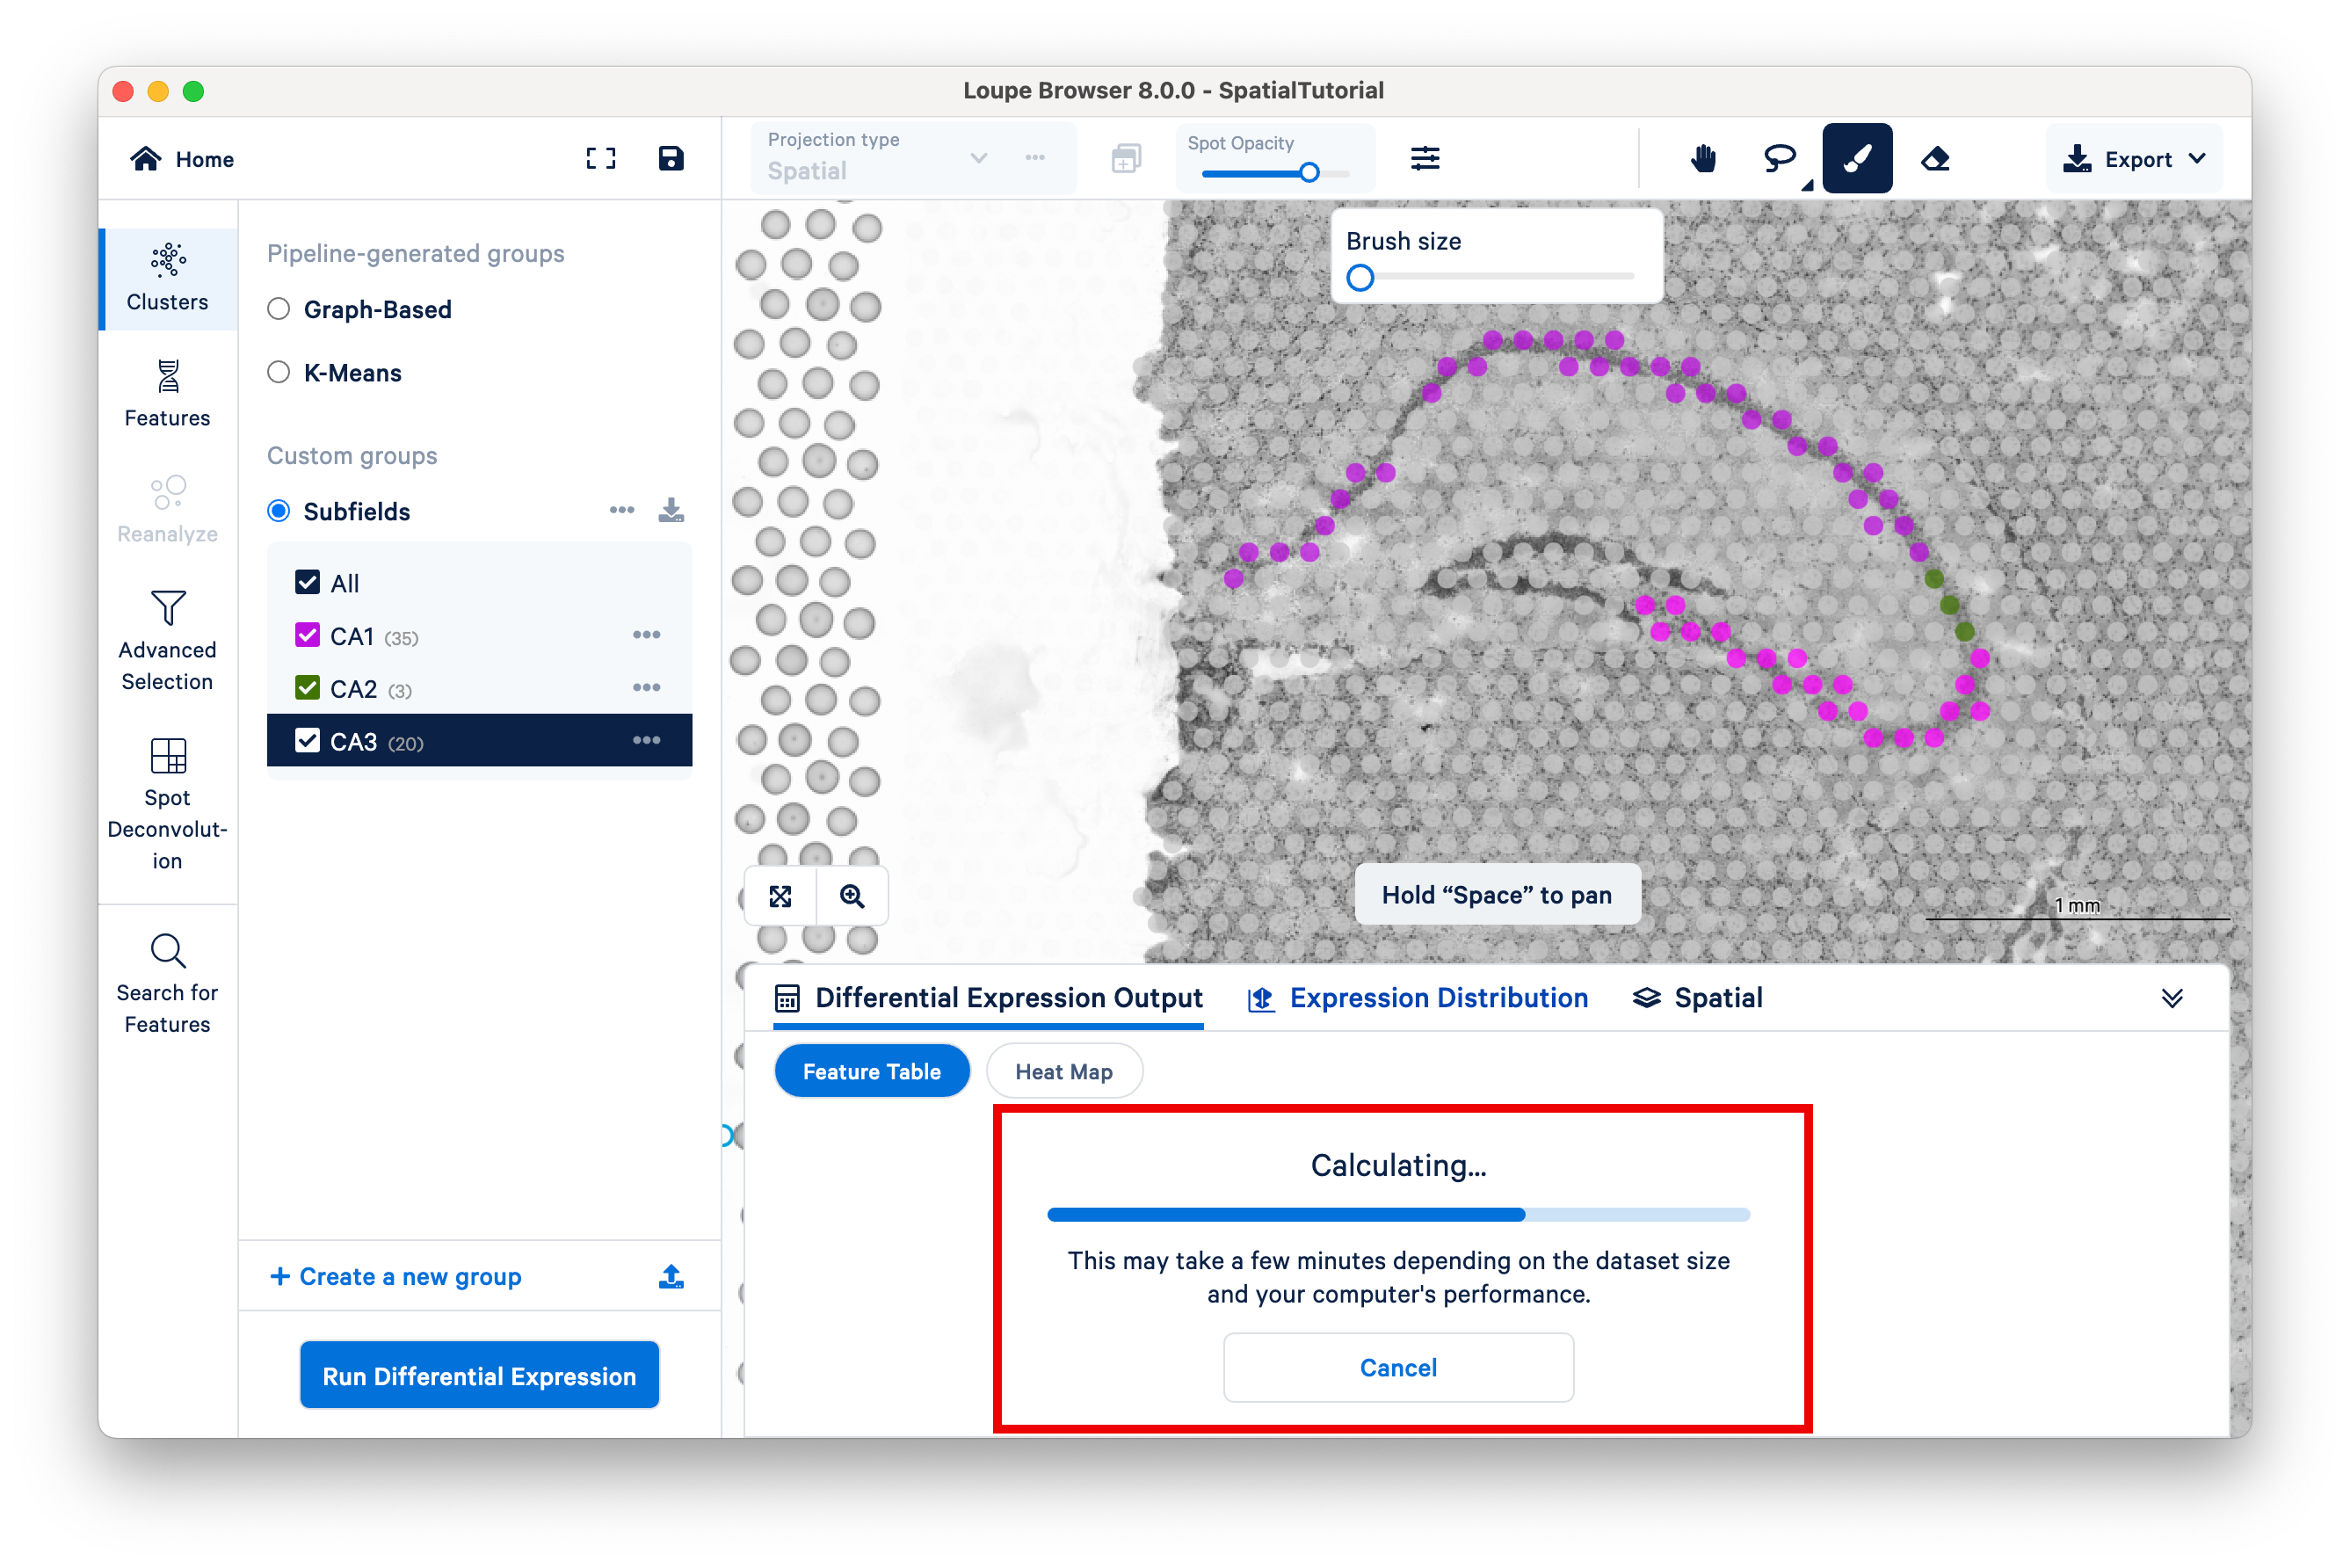
Loupe will momentarily perform the calculations.
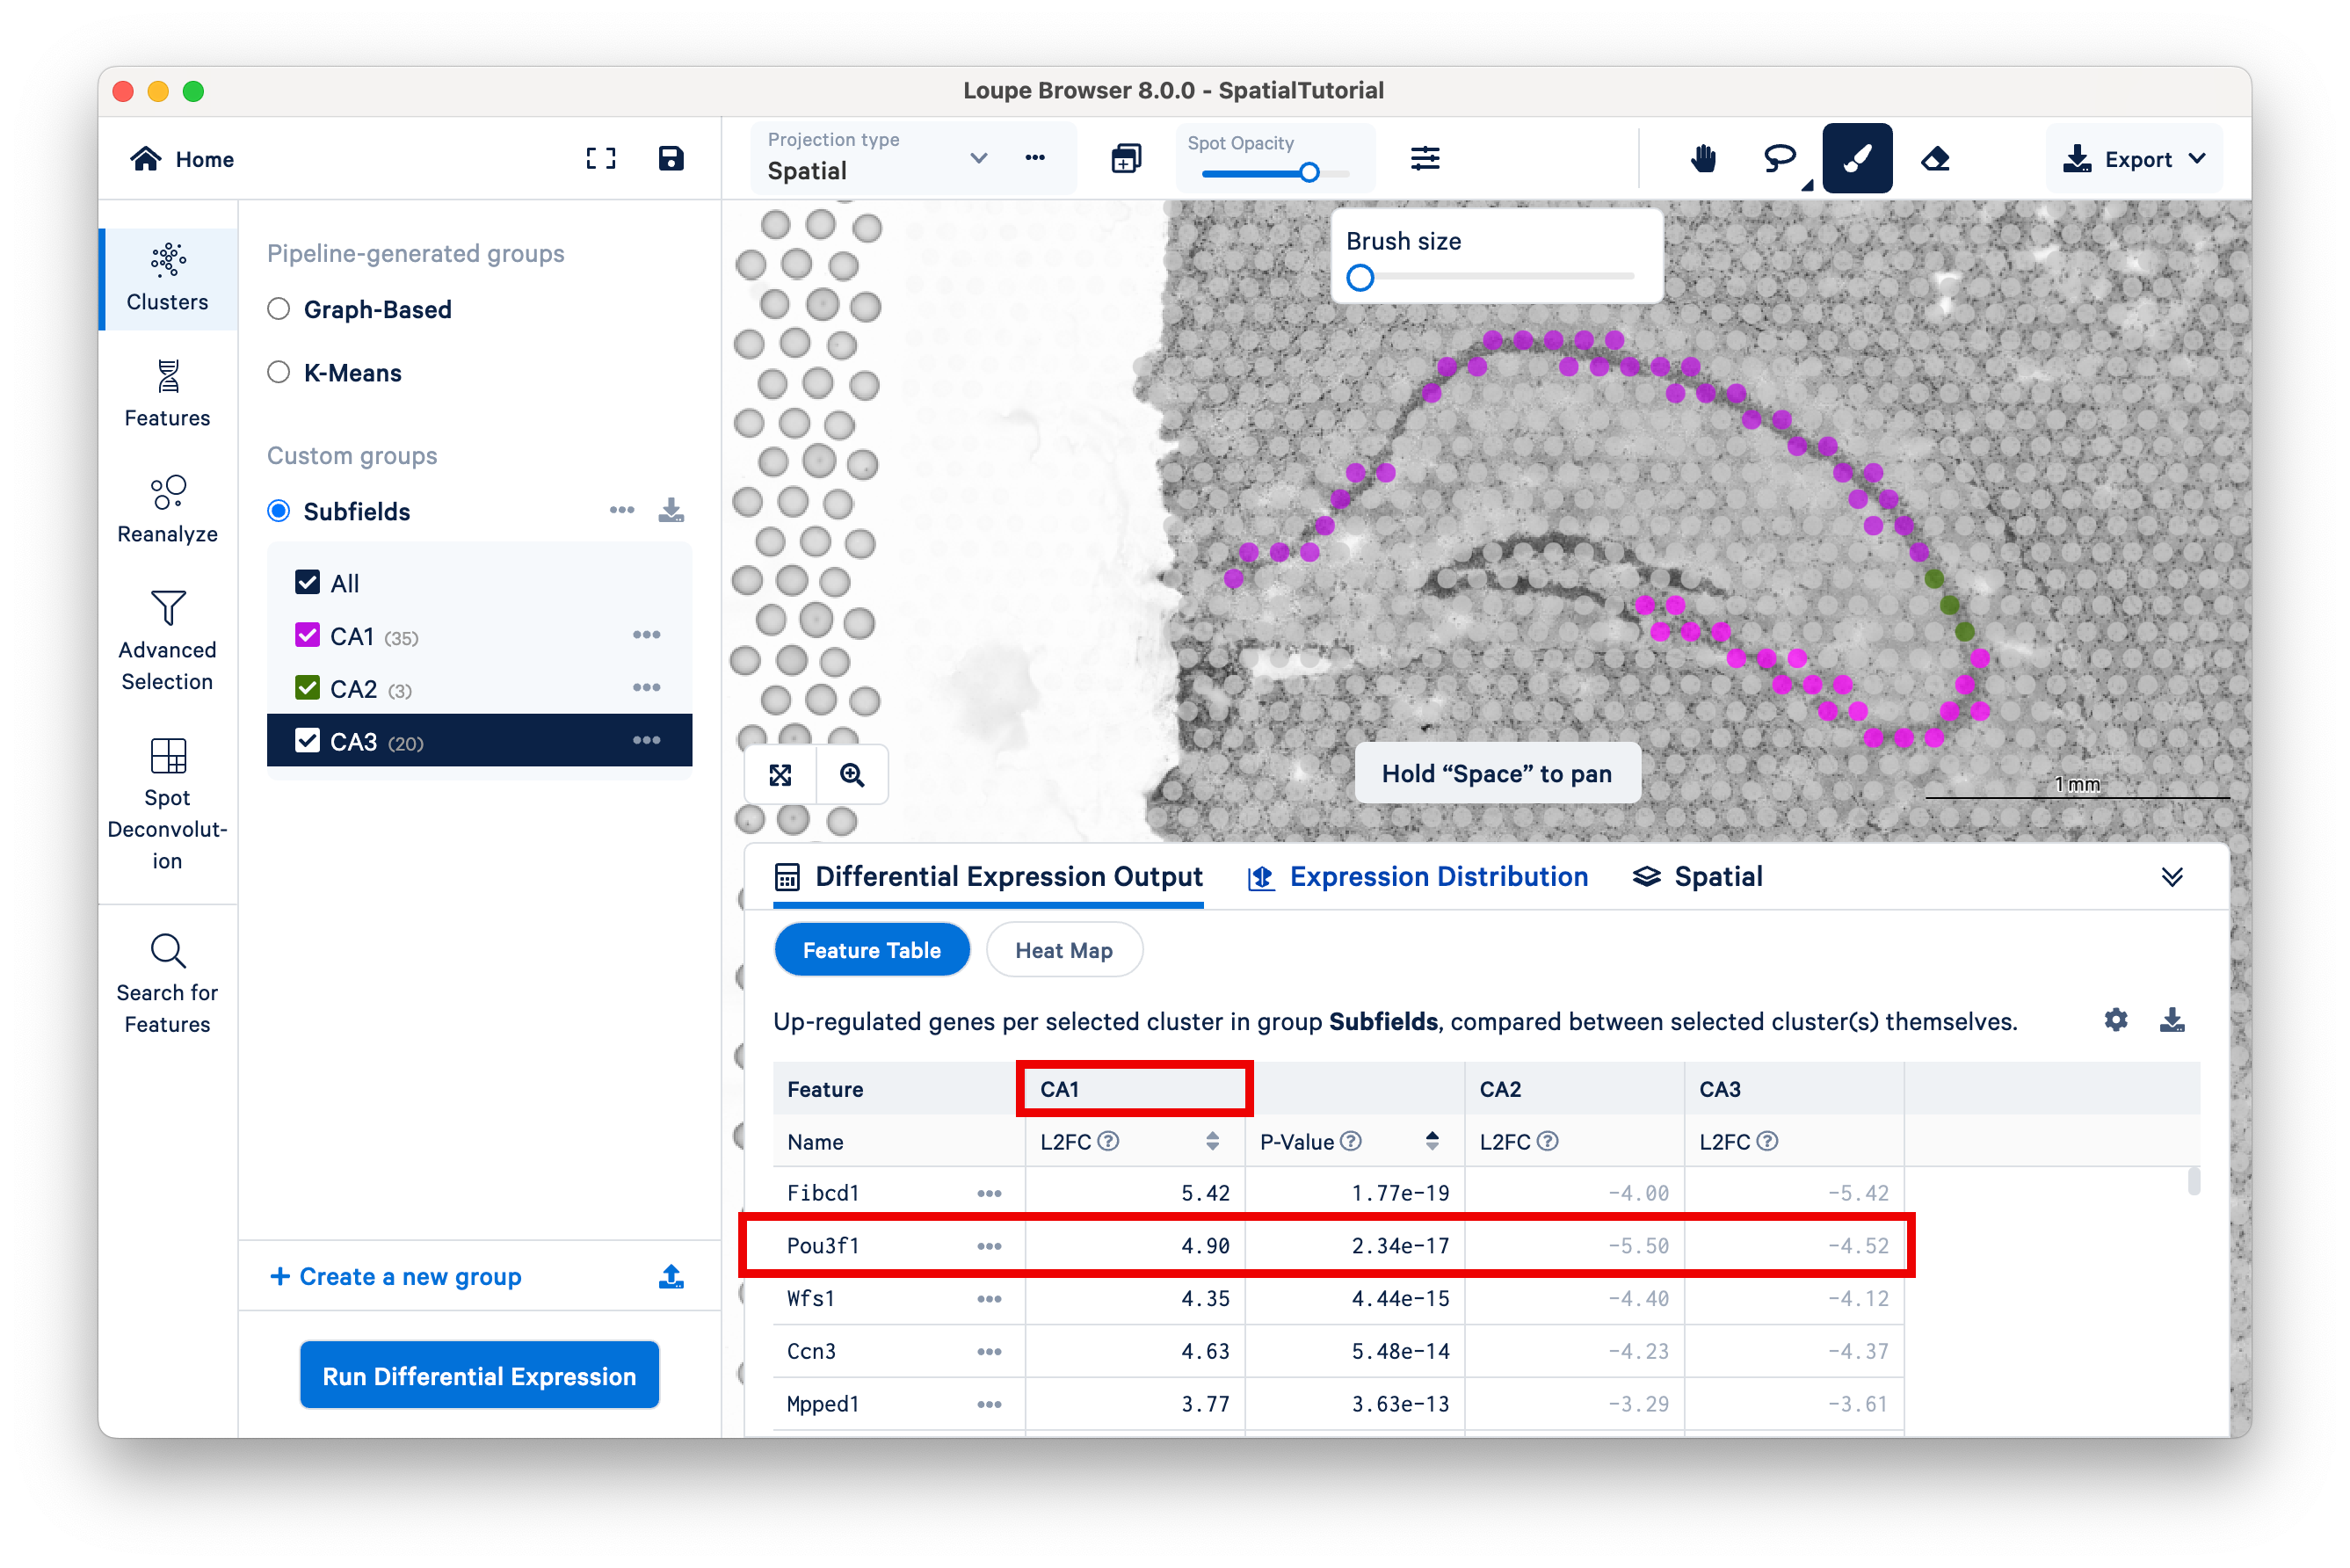
After the calculations are complete, a new heatmap and data table are populated on the bottom.
We can now examine the region-specific genes for their spatial expression patterns. For example, Pou3f1 is a neuronal fate transcription factor that is enriched in the excitatory neurons of CA1 subfield of hippocampus. To view the resulting expression, add the gene to the feature list.
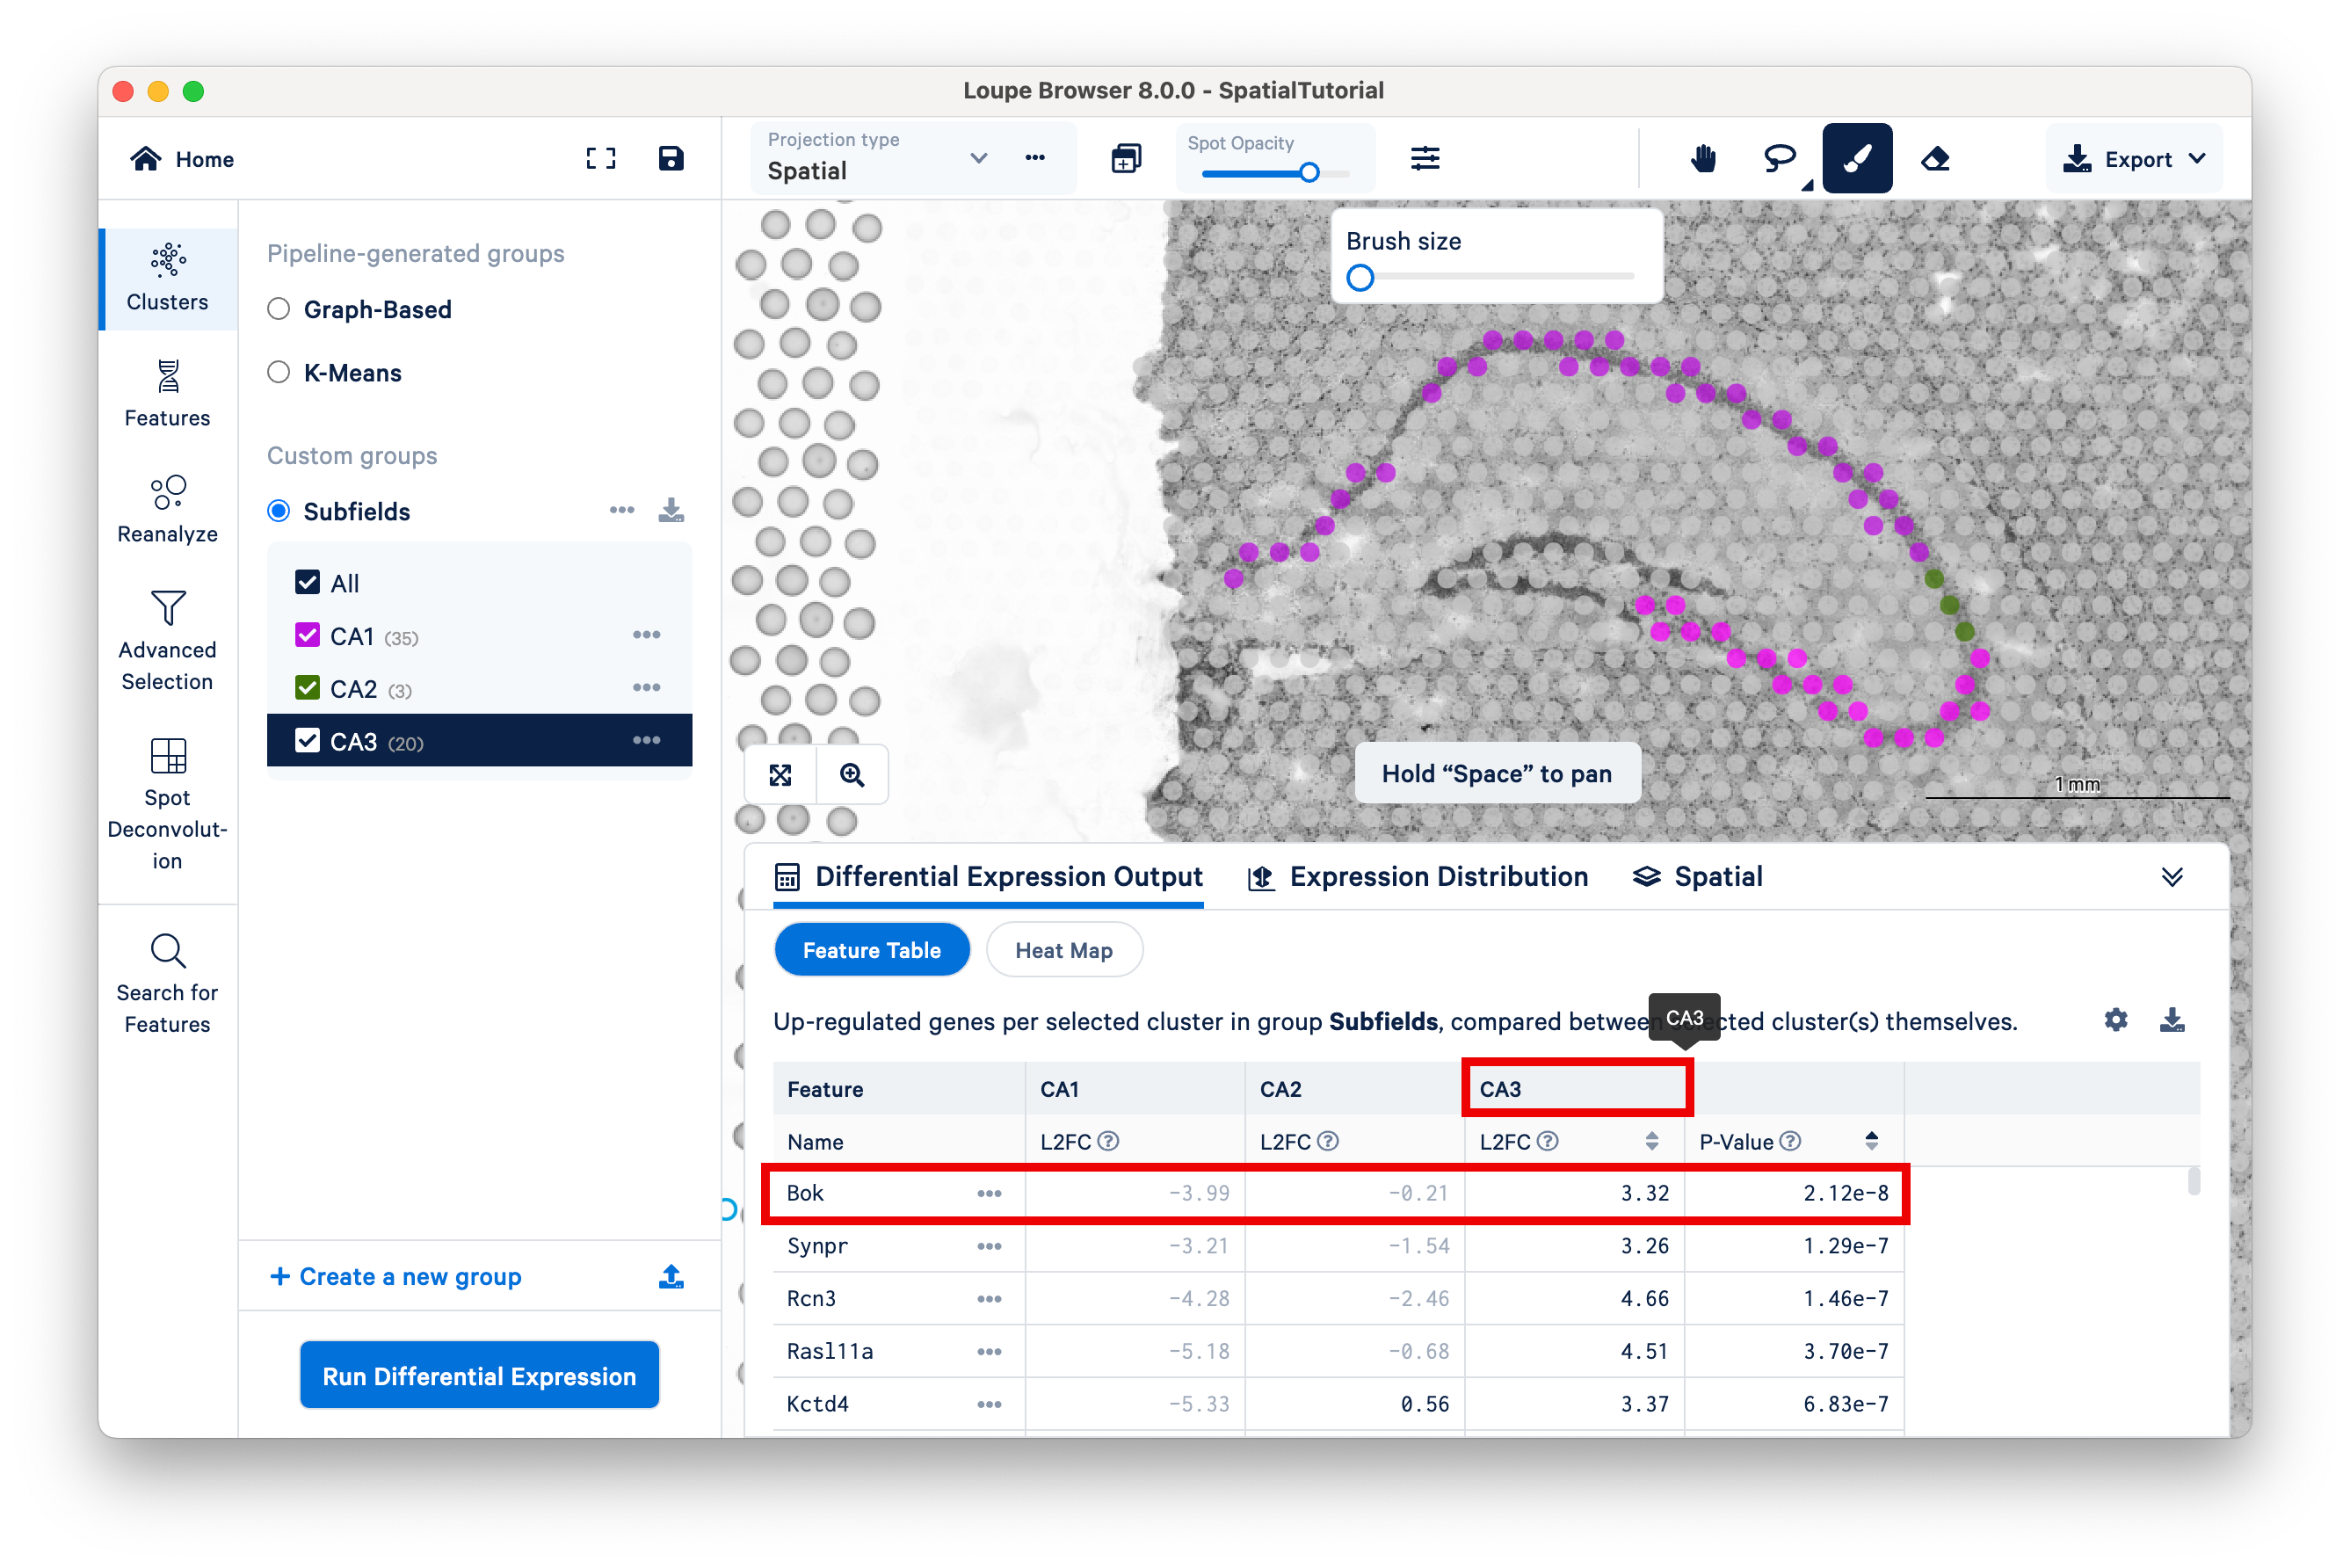
Similarly, Bok is highly enriched in CA3 and its expression pattern is consistent for the subfield.
In this section, we covered how to use known marker genes to define custom clusters, and how to perform differential gene expression among those clusters to discover new markers, highlighting the power of the whole transcriptome in Visium Spatial Gene Expression.
In the next section, we will address spatial reclustering.