Human Lung Cancer, 11 mm Capture Area (FFPE)
Spatial Gene Expression dataset analyzed using Space Ranger 2.0.1
Learn about Visium analysis
10x Genomics obtained FFPE human lung cancer tissue from Avaden Biosciences. The tissue was sectioned as described in the Visium CytAssist Spatial Gene Expression for FFPE – Tissue Preparation Guide (CG000518). Tissue section of 5 µm was placed on a standard glass slide, then stained following the Deparaffinization, H&E Staining, Imaging & Decrosslinking Demonstrated Protocol (CG000520). The glass slide with tissue section was processed via Visium CytAssist instrument to transfer analytes to a Visium CytAssist Spatial Gene Expression Slide v2, with 11 mm capture areas following the Visium CytAssist Spatial Gene Expression Reagent Kits User Guide (CG000495).
- Diagnosis: Lung Cancer, Neuroendocrine Carcinoma
- Stage (AJCC): IB
- TNM system: T2aN0MX
- FFPE Block Age < 1 year
- DV200: 73
The H&E image was acquired using Olympus VS200 Slide Scanning Microscope with these settings:
- Olympus Objective magnification: 20x UPLXAPO Objective
- Numerical Aperture: 0.8
- ScopeLED light source: Xcite Novum
- Camera: VS-264C
- Exposure: 500 µs
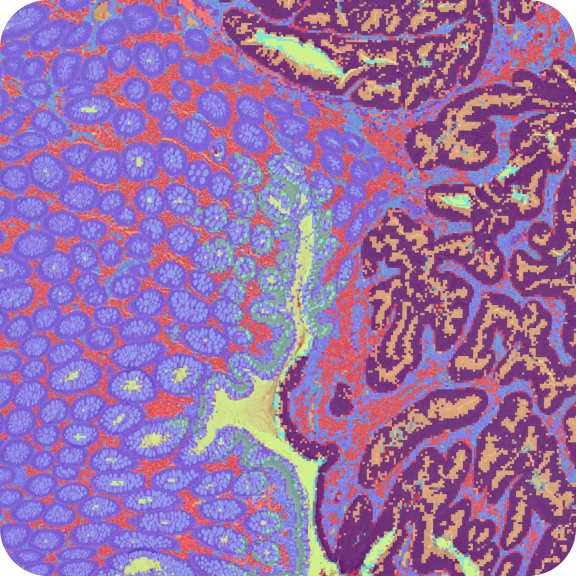
From the H&E image, vascular invasion and some compressed hemorrhage portion in the tumor, along with a clear stromal boundary outside the solid tumor region can be observed.
Libraries were prepared following the Visium CytAssist Spatial Gene Expression Reagent Kits for FFPE User Guide (CG000495).
- Sequencing instrument: Illumina NovaSeq 6000, flow cells HJWFGDSX5 and HJW2WDSX5 (lane 1-4)
- Sequencing depth: 844,866,053 reads / 45.9% saturation
- Sequencing configuration: 28bp read 1 (16bp Visium spatial barcode, 12bp UMI), 90bp read 2 (transcript), 10bp i7 sample barcode and 10bp i5 sample barcode
- Dual-Index set: SI-TS-B3
- Slide: V52Y10-286
- Area: B1
Key cell metrics were:
- Spots detected under tissue: 6,195
- Median UMI counts per spot: 66,268
- Median genes per spot: 10,087
This dataset is licensed under the Creative Commons Attribution 4.0 International (CC BY 4.0) license. 10x citation guidelines available here.