What are the benefits of single cell sequencing?

Single cell sequencing approaches allow scientists to define cell type–specific gene expression and multiomic readouts, resolving the cellular heterogeneity that drives the expression patterns seen from bulk RNA-seq. Keep reading to explore the value of single cell RNA-sequencing and single cell multiomics, the high-impact science powered by these methods, and the familiar steps involved in conducting a single cell sequencing experiment.
Enabling high-impact science
Understanding the impact of single cell RNA-sequencing (scRNA-seq) sometimes requires stepping into the shoes of the scientists that look to it for answers to some of the biggest questions in health and disease. Imagine you’re a neuroscientist looking to understand the healthy cellular processes that are dysregulated in neurodevelopmental disease. Or an immunologist searching for the gene expression signatures and biomarkers that define an inflammatory condition. Perhaps you’re a cancer researcher trying to uncover the intratumoral heterogeneity that confounds therapies.
Bringing these answers into focus requires innovative experimentation and technological capabilities that continuously push the boundaries of what’s possible—because discoveries are made at the leading edge of technology.
Scientists in other fields have experienced the same reality. A telescope with two lenses allowed Italian astronomer Galileo Galilei to observe craters in the moon. But a redesigned telescope with higher quality lenses and a longer shaft magnified his vision eightfold—then, through further refinement, thirtyfold, bringing the planet Jupiter and three of its orbiting moons into clear view (1).
How can single cell RNA sequencing uniquely benefit your research?
Biology is like the universe. It is highly complex, with many unique singular bodies—cells—interacting with one another and playing different roles to build and drive processes within a larger system. Like Galileo’s efforts to explore the universe, discovering and defining these cells requires high-resolution tools able to untangle the gene expression heterogeneity that contributes to biological complexity.
When do you need single cell resolution?
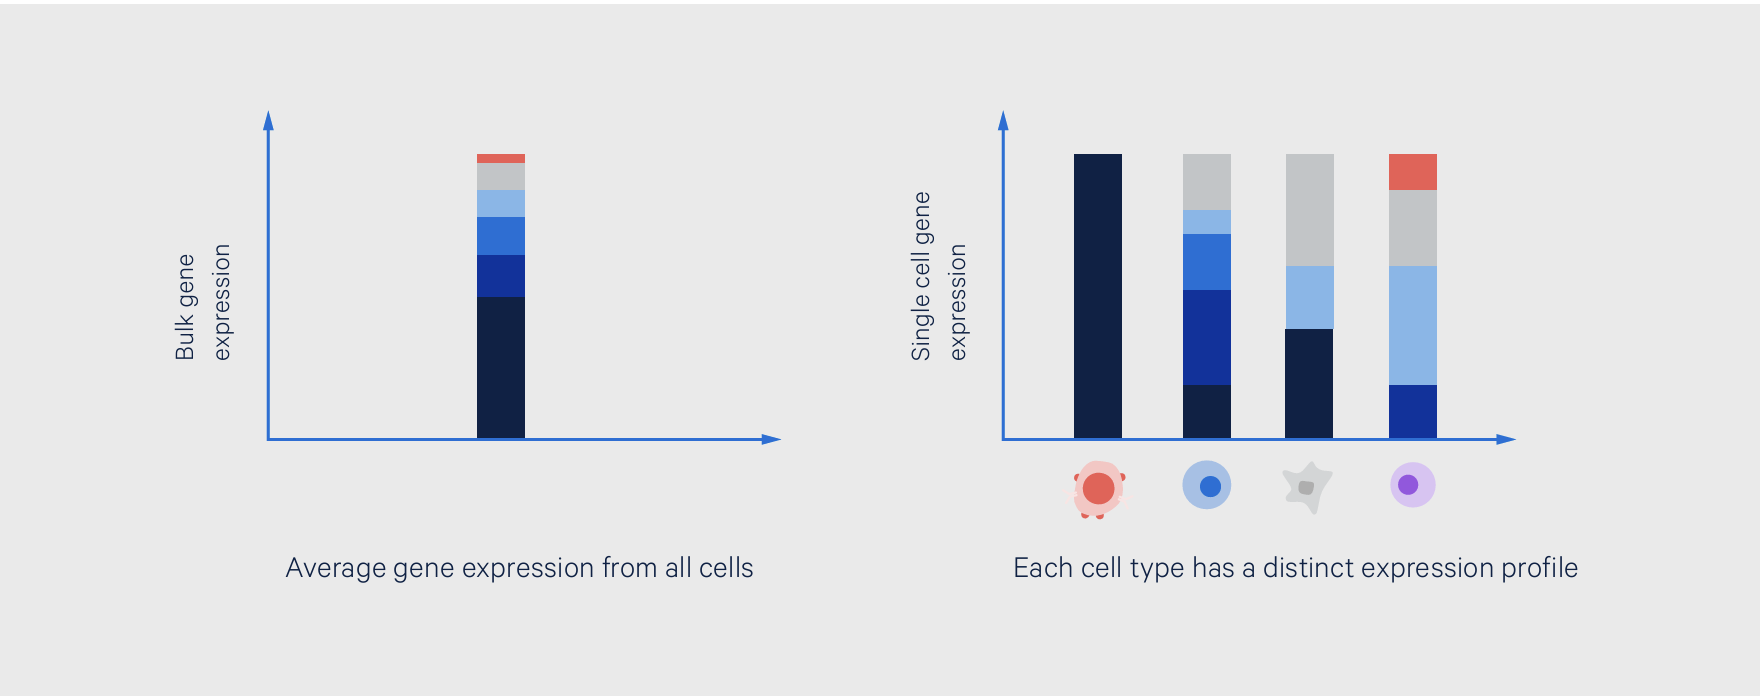
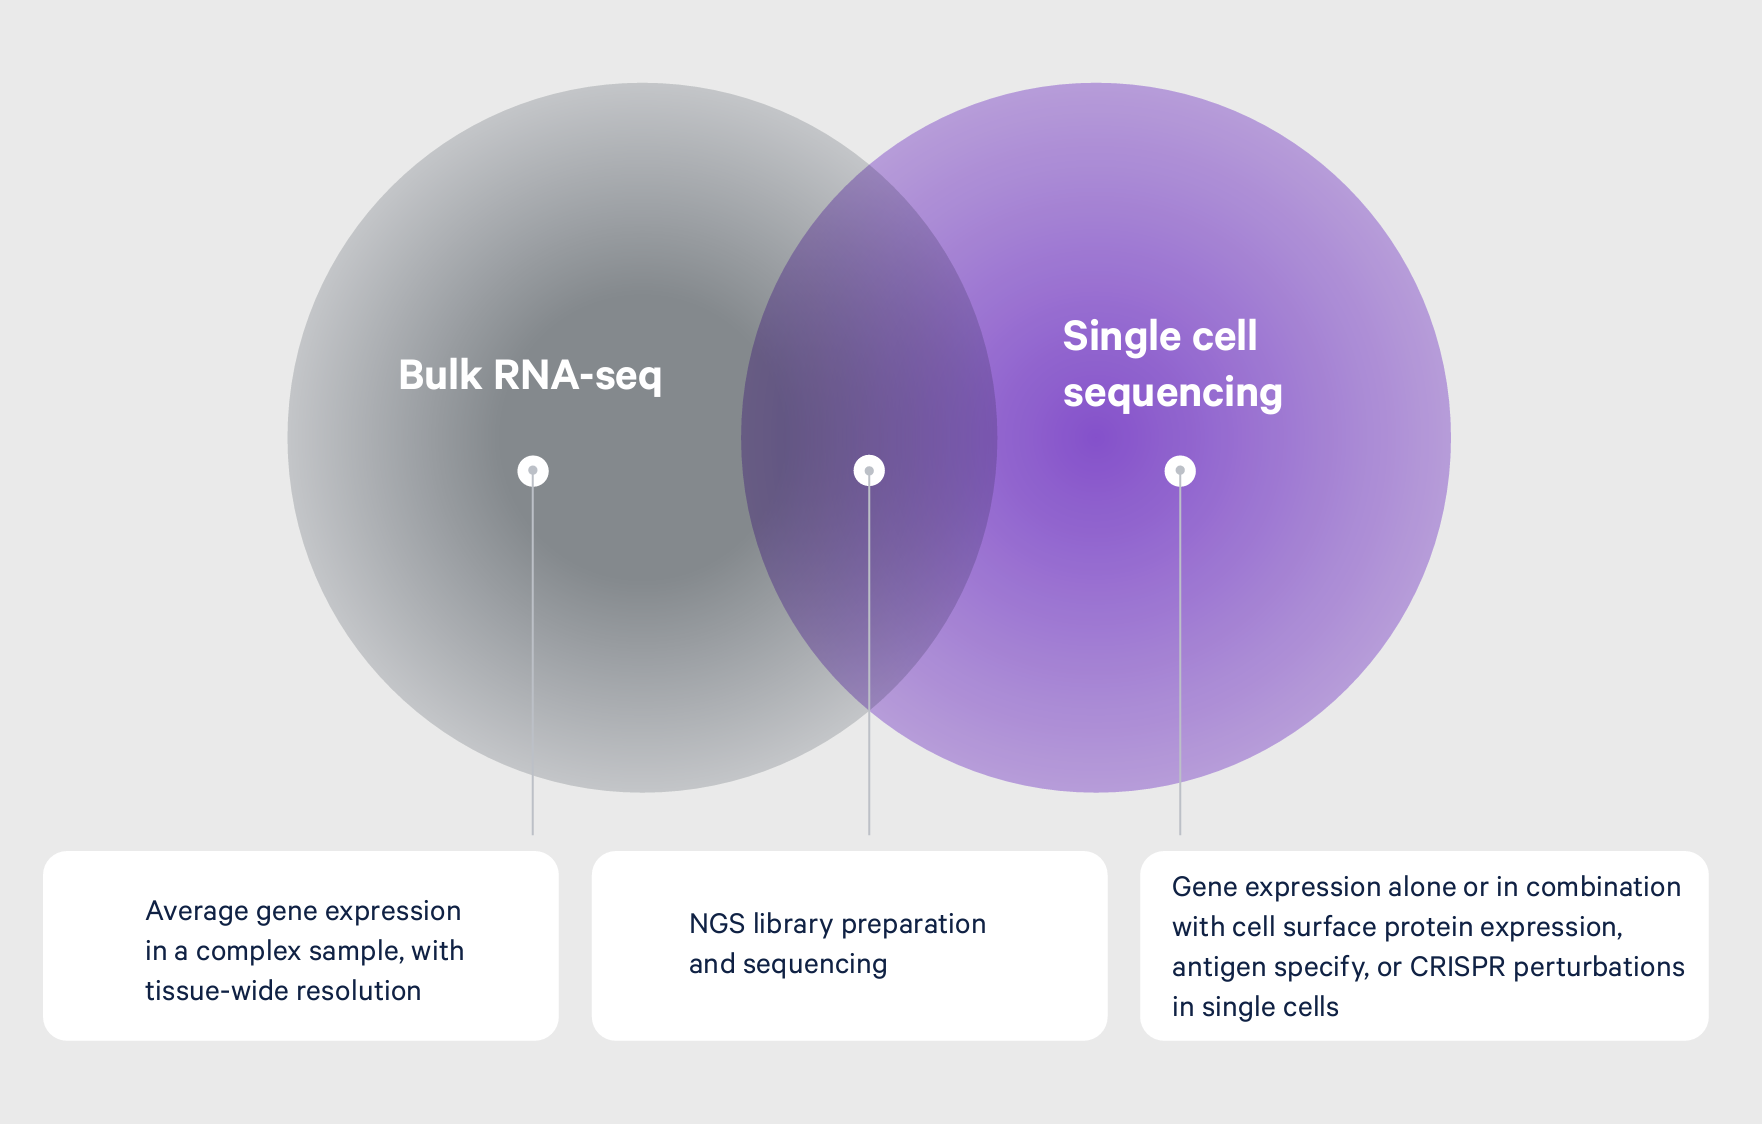
Bulk transcriptomic approaches like RNA sequencing (RNA-seq) or microarray analysis represent a powerful class of tools that helped scientists begin to unravel this heterogeneity, providing an average view of gene expression from a mixed sample. Subsequent leaps in technological innovation have culminated in single cell approaches that allow scientists to define cell type–specific gene expression, resolving the cellular heterogeneity that drives the expression patterns seen from an average readout (Figure 1). This gives researchers the ability to more fully characterize tissue heterogeneity, identify rare cell types, and dissect molecular mechanisms cell by cell. With a truer picture of their biological systems, researchers have a confident foundation of knowledge from which they can plan their next experiments and generate deeper, actionable insights.
For example, researchers at Wellcome Sanger Institute (Cambridge, UK) used single cell and bulk RNA sequencing to chart evolution of the innate immune response in mammals (2). The innate immune response displays high variability across responding cells. While the bulk RNA-seq analysis examined transcriptional divergence in response between species, single cell RNA-seq looked at cell-to-cell differences. The authors examined single cell gene expression over a time course—including stages of response both earlier and later than the bulk measurement—to include the dynamics and magnitude of response.
Transcriptional profiling identified hundreds of genes that diverge in pathogen response across mammalian species. High divergence genes, including cytokines, have distinct promoter structures, which are dense with transcription factor binding motifs. Genes involved in immune regulation, such as transcription factors and kinases, are relatively conserved in their response to immune challenge.
Single cell analysis revealed that high divergence genes show higher cell-to-cell expression variability than seen with low divergence genes. These findings provided clues about the mechanisms that have evolved to fine-tune the pathogen response.
How can RNA readouts maximize insights from single cell analyses?
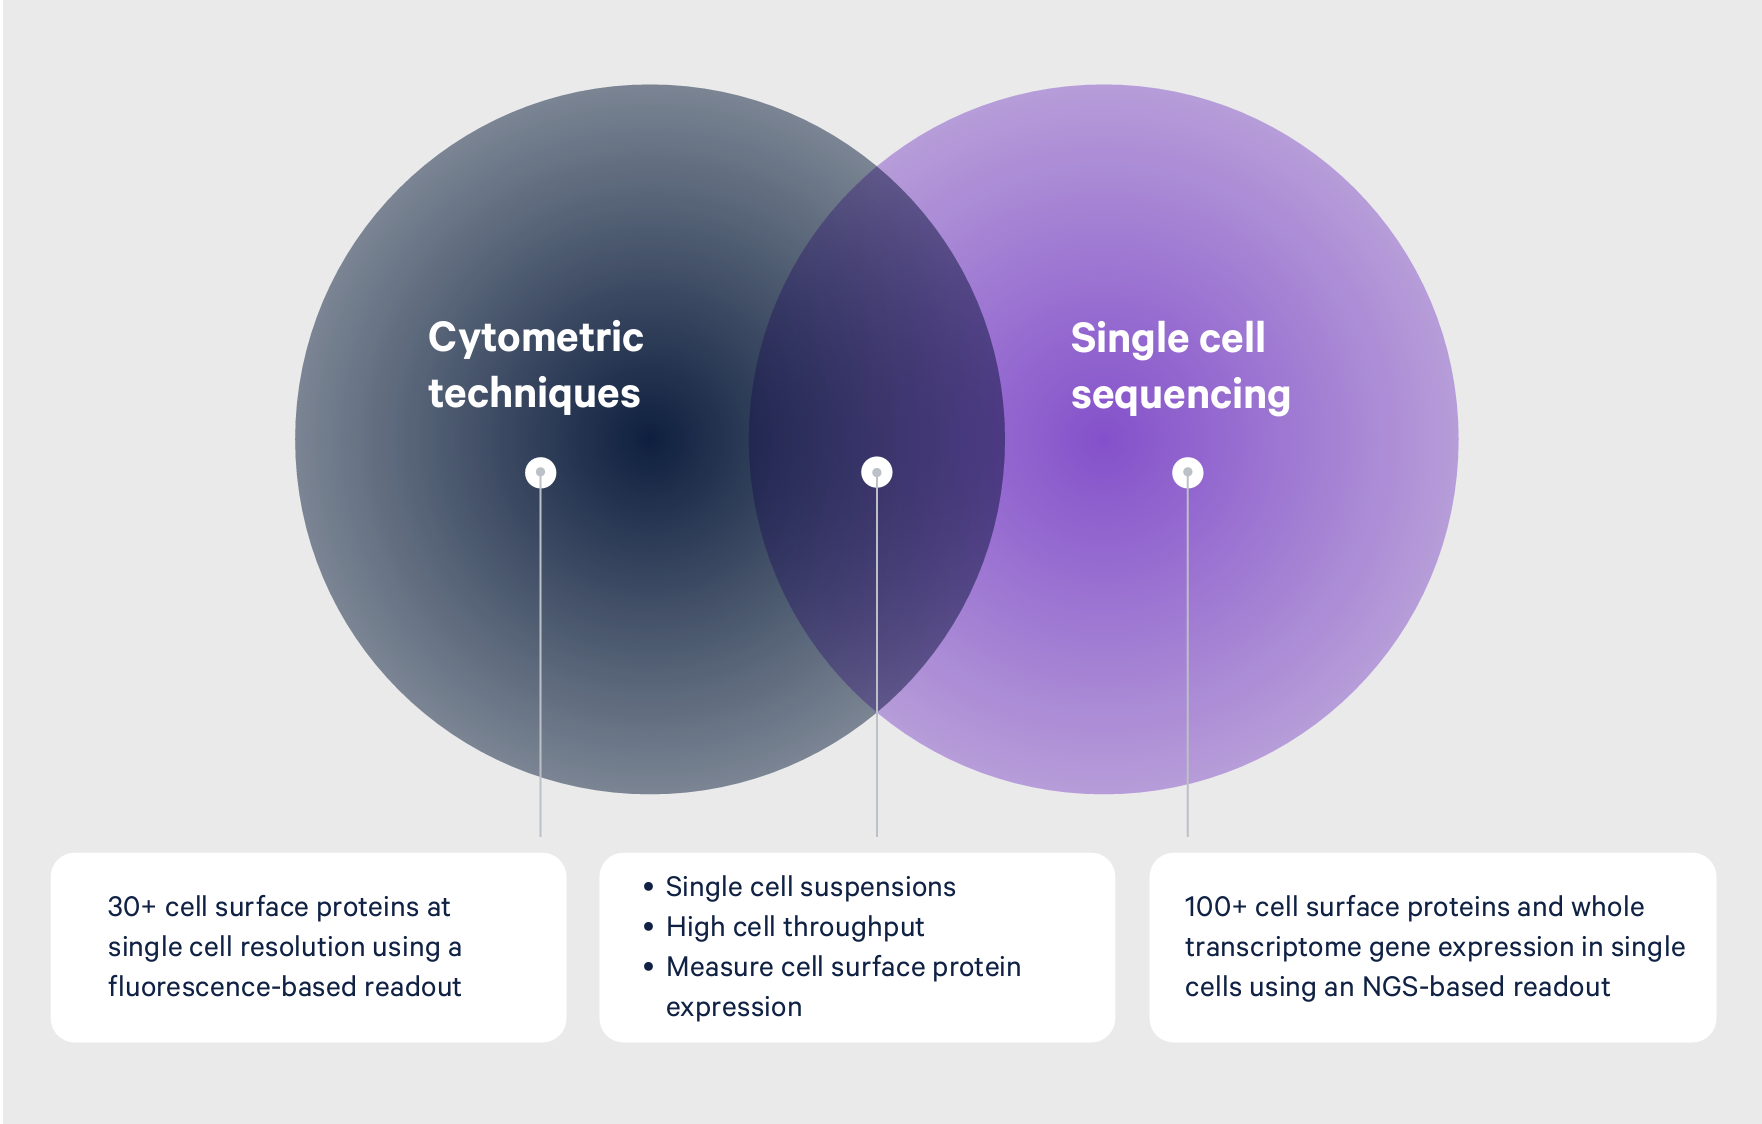
Other techniques, including flow cytometry, can sort cells and provide insights into cellular identity through a single cell readout of a defined set of proteins. However, the expression patterns of select proteins may not be enough to capture the full picture of cellular heterogeneity or dynamic cell states, in much the same way that knowing someone’s physical traits—height, hair color, eye color—can only provide a limited perspective of who they are.
For example, immunologists have historically used cell surface proteins to categorize immunological subsets. But when cells differentiate from one cell to another, genes are rapidly and dynamically regulated to move the cell forward to the next stable cell state. Cell surface markers don’t always change in a significant way between one cell type to another, leaving these transient states undetectable.
scRNA-seq, however, enables researchers to analyze transcript levels from individual cells in samples with actively differentiating cells, giving researchers the resolution needed to parse transient cell states.
In one example, researchers combined scRNA-seq and flow cytometry to identify transient populations of hematopoietic stem and progenitor cells that drive successful autologous stem cell transplantations in patient samples from an international, multicenter phase 3 clinical trial that tested the improved efficacy of a new combination therapy for HSPC mobilization in people with multiple myeloma (3).
How can single cell multiomics benefit your research?
Moving beyond descriptive analysis toward a functional understanding of the diverse cell types in a complex sample increasingly requires a multiomic perspective of cellular biology. Through single cell multiomics—the analysis and integration of datasets from different omic groups—scientists can measure multiple cellular features from the same single source. Such features include whole transcriptome gene expression, cell surface protein expression, immune repertoire sequences, including T- and B-cell receptors (TCR/BCR), and regions of open chromatin for a view of epigenomic regulation. With more information-rich data from a single experiment, researchers gain the additional advantages of preserving precious samples, increasing productivity, reducing errors caused by batch effects, and saving other high-commodity resources, from grant funds to personnel time.
Breakthroughs enabled by single cell multiomics
More than improving experimental processes, single cell multiomic methods are helping scientists make new inroads into the most crucial areas of health and disease research. Discoveries that would not have been possible with an averaged view of transcription or a single parameter readout are now changing how we understand and approach treatment for cancer, infectious disease, neurodegenerative conditions, and more.
For example, single cell immune profiling provides a multiomic solution to immunology questions, enabling whole transcriptome detection, along with cell surface proteins and paired, full-length receptor sequences of T or B cells.
Researchers led by a team at The Francis Crick Institute in London used single cell immune profiling to study the tumor microenvironment of clear cell renal cell carcinoma (ccRCC)—the most common form of kidney cancer—and uncover mechanisms that drive therapeutic response and resistance in this immunogenic tumor (4).
Researchers often struggle to interrogate the immune landscape of immunogenic tumors with high intratumor heterogeneity, such as ccRCC. Bulk RNA-seq provides an incomplete picture, and even scRNA-seq alone is insufficient to profile key immune cell populations. With simultaneous analysis of TCR sequences and gene expression profiles from the same individual cells, the researchers could measure clonal expansion and identify often overlooked immune cells in the tumor microenvironment.
Ultimately, they identified key differences between responders and non-responders. The researchers found that a sample from a patient who responded to the drug nivolumab contained an expanded population of intratumoral CD8+ T cells that bound to nivolumab and expressed PD-1, while a sample from a non-responder did not.
From identifying novel cell types and states, to unlocking the underlying mechanisms of disease and therapeutic response and resistance, single cell sequencing is fueling groundbreaking research with the potential to transform biology and medicine. Whether it’s unexplained diseases or unexplored systems in the human body or nature, what was once blurry is now becoming clear. And much like Galileo’s telescope, the tools at hand are allowing for increased focus and magnification as we move towards a future of science defined by new depths of insights that, only a decade ago, many could not have imagined.
What are the steps involved in conducting a single cell sequencing experiment?
As with learning any new technique, there may be elements of the single cell sequencing workflow that are currently unfamiliar to you. Though methods like flow cytometry, RNA-seq, and qPCR have already been established in your processes and institutions, the possibility of taking your research to the next level with a new method can offset the learning curve.
The differences between single cell sequencing and these methods—including the implementation of next-generation sequencing and data analysis—shouldn’t be minimized, however there are a number of similarities between them that can give you confidence in your ability to step into the world of single cell sequencing. Past training and experiments, like muscle memory, contribute technical knowledge, hands-on skills, and intuition. These, combined with practice, will enable your success with a new method.
Just another experiment: Starting with sample prep
Every biological experiment, including single cell techniques, can be broken down into a few key steps: preparing a sample, running an assay, and looking at results.
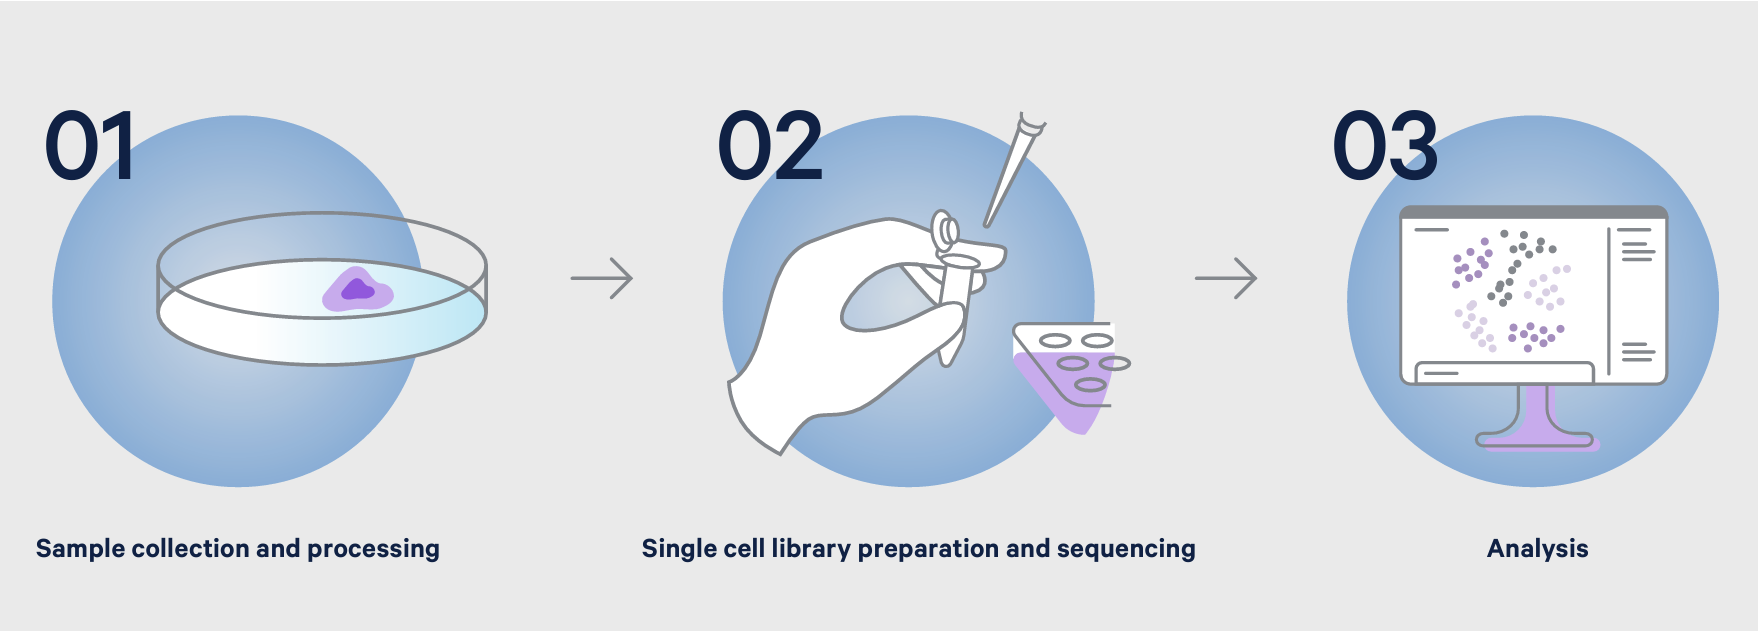
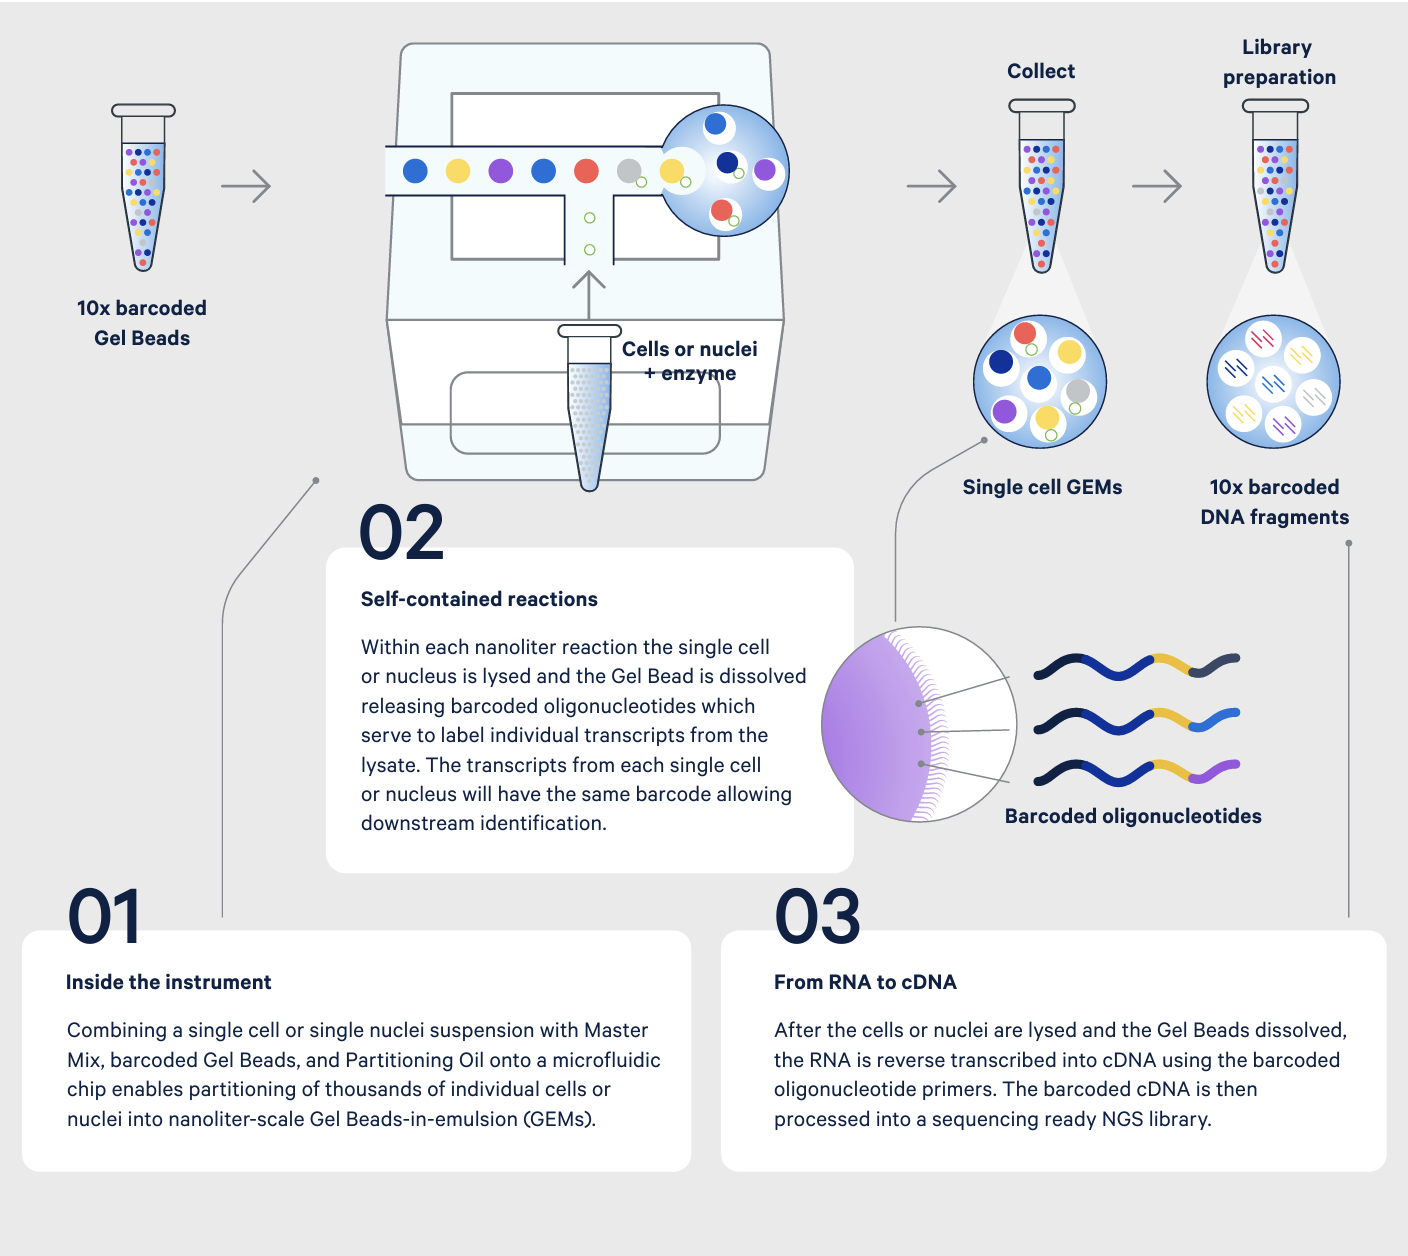
The first step in a single cell sequencing experiment, sample preparation, aligns closely with what you may already be familiar with as a flow cytometry user—namely, generating viable single cell suspensions from whole samples that have been digested through an enzymatic or mechanical process, cell sorting, or other cell isolation techniques. This is followed by cell counting and quality control steps to ensure your sample has an appropriate concentration of viable cells and is free of clumps and dead cell debris. If desired, you can also stain your sample with antibodies to label cell surface proteins and other biological analytes, or perform FACS enrichment for cell types of interest.
The steps taken to dissociate a sample will vary based on your starting material and the goals of your experiment. Additional preparation steps may be necessary depending on the quality of the tissue, sample abundance, cell size, or the need to extract nuclei for chromatin accessibility profiling from genomic DNA. Regardless of these specific considerations, the same basic principle of generating a high-quality single cell suspension applies across sample types.
Gene expression three ways: It’s all about the cDNA
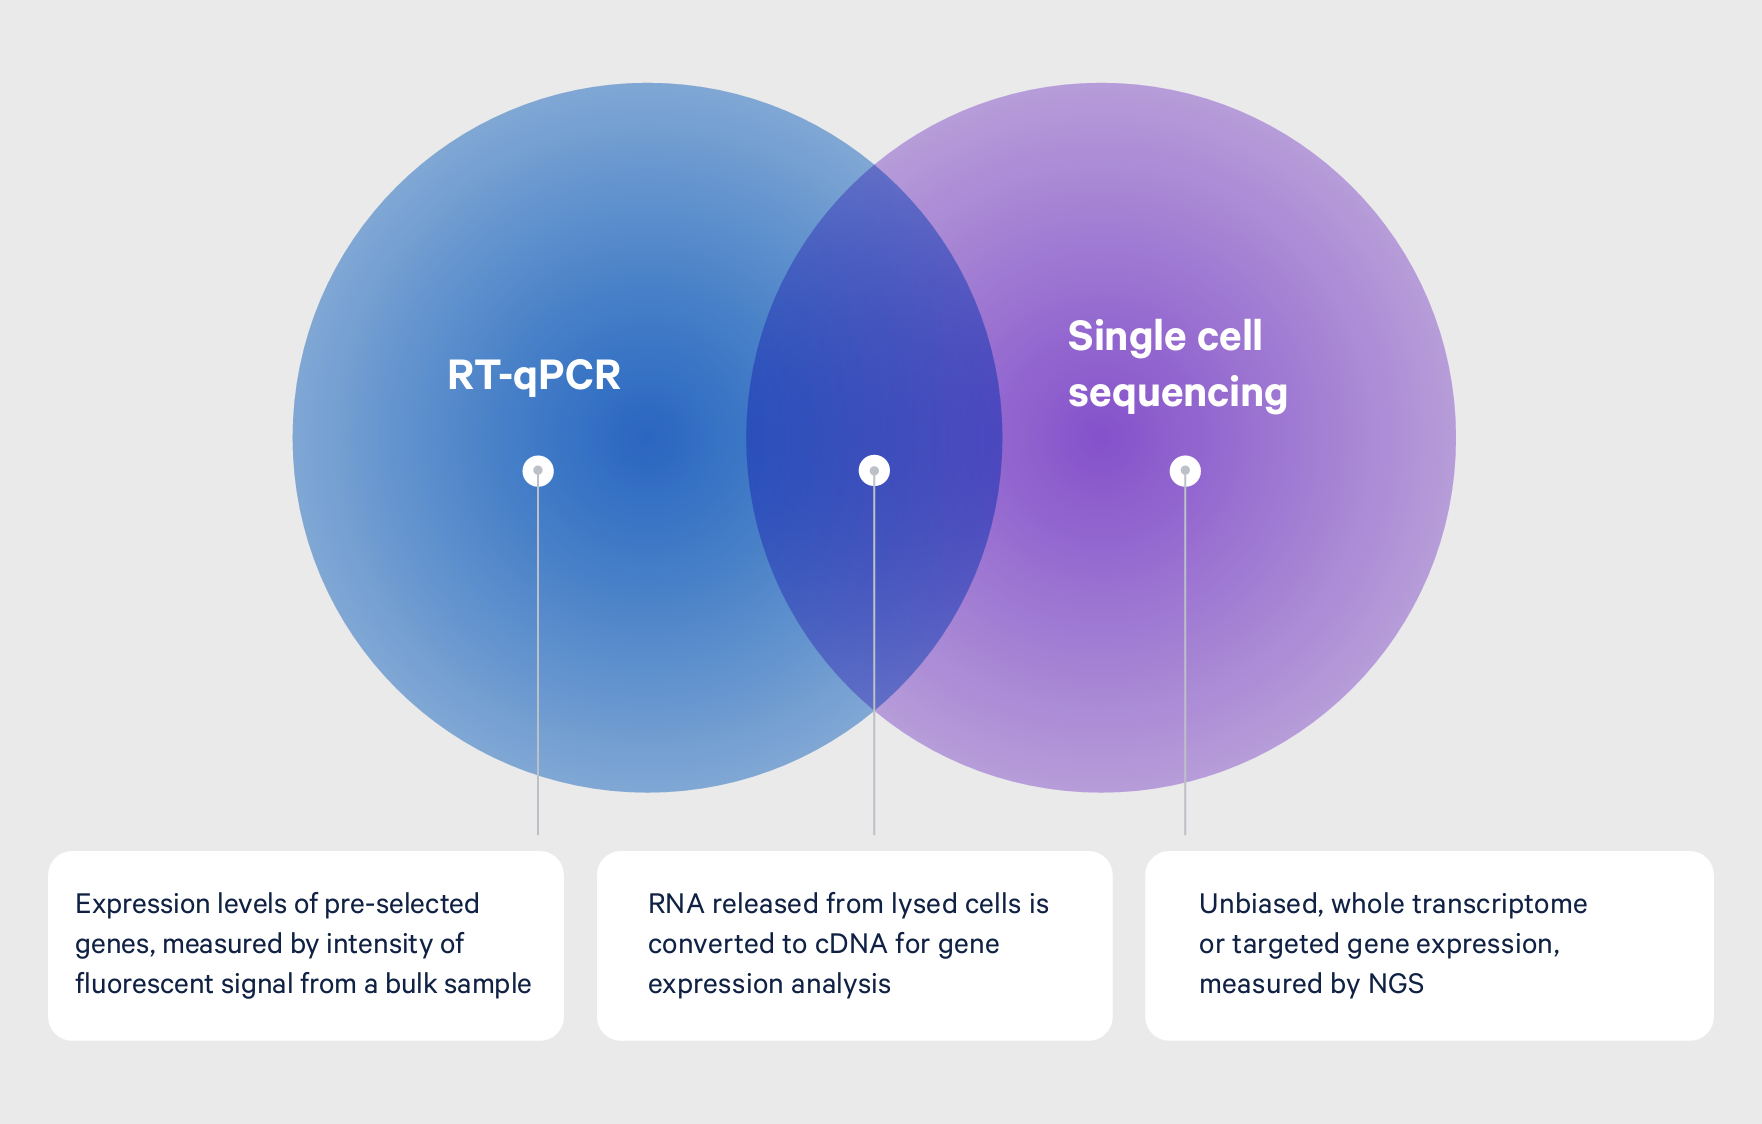
Single cell RNA-seq, RNA-seq, and reverse transcription qPCR (RT-qPCR) share a common process of isolating RNA and converting it to cDNA for analysis. Each assay differs, however, in regards to how this process is performed and the final readout. Both RNA-seq and RT-qPCR start by isolating RNA from a population of cells in bulk and then converting it to cDNA. For RNA-seq, the cDNA is used to create a next-generation sequencing library, enabling measurement of gene expression across the entire transcriptome.
For RT-qPCR, specific targets are amplified from the cDNA and expression levels measured by fluorescence (5). While RT-qPCR is limited to known targets, RNA-seq provides unbiased whole transcriptome gene expression. Both, however, only provide a view of the average gene expression across a population of cells. With single cell RNA-seq, single cells are isolated into wells or individual micro-reaction vessels before the RNA is isolated. The RNA is then labeled with cell-specific barcodes, ensuring cDNA from each cell can be traced back to the cell of origin. Similar to RNA-seq, the barcoded cDNA is used to create a next generation sequencing library, enabling measurement of gene expression across the entire transcriptome of each individual cell.
A common goal: Understanding the transcriptome
Whether starting with RNA from bulk samples for RNA-seq or RT-qPCR, or from single cells for single cell RNA-seq, each technique is ultimately looking at the same endpoint data: levels of gene expression.
Among these assays, there is a common approach to data analysis, including analyzing differential gene expression between experimental or sample conditions, such as normal versus diseased. For example, comparing the transcriptional profile of a control sample and inflamed skin tissue can reveal transcriptional signatures that define the inflammatory state and the gene activity that is dysregulated in the disease context. With single cell resolution, you can take these transcriptional insights to the next level, identifying whether there is a specific subset of cells responsible for the inflammatory response.
Leveraging known gene expression markers from your experiences of quantifying gene expression through RNA-seq and RT-qPCR experiments, and a familiar mode of differential gene expression analysis— similar to that of both RNA-seq and RT-qPCR data—the jump to single cell gene expression can be very intuitive. Additionally, 10x Genomics software can help you make a smooth transition to single cell data, with easy-to-use tools for data analysis and visualization.
Elevating insights with single cell multiomics
A sequencing-based readout is ultimately powerful because it can provide access to multiple biological analytes from the same single cell. If single cell gene expression provides highly detailed information in one color, then single cell multiomics offers the same detail but across the full color spectrum, giving you the most true-to-life view of your sample.
Continued innovation is allowing the 10x Genomics Chromium Single Cell platform to provide a readout of multiomic features of cellular complexity from the same single cells. As opposed to traditional methods, single cell multiomics streamline the experiments you need to run and the samples you need to analyze to get equivalent results. This not only conserves precious samples, but also ensures greater biological accuracy, as you do not need to match datasets from split samples and infer relationships between omic types computationally.
The end result of a single cell sequencing experiment is well worth the effort to understand and become competent in running it. With the experiment done and data in hand, discovery begins.
References:
- Library of Congress, Digital Collections. Finding Our Place in the Cosmos: From Galileo to Sagan and Beyond. Galileo and the Telescope. https://www.loc.gov/collections/finding-our-place-in-the-cosmos-with-carl-sagan/articles-and-essays/modeling-the-cosmos/galileo-and-the-telescope/
- Hagai T, et al. Gene expression variability across cells and species shapes innate immunity. Nature 563: 197–202 (2018). doi: 10.1038/s41586-018-0657-2
- Crees ZD, et al. Motixafortide and G-CSF to mobilize hematopoietic stem cells for autologous transplantation in multiple myeloma: a randomized phase 3 trial. Nat Med 29: 869–879 (2023). doi: 10.1038/s41591-023-02273-z
- Au L, et al. Determinants of anti-PD-1 response and resistance in clear cell renal cell carcinoma. Cancer Cell 39: 1497–1518 (2021).
- Wagner E. Monitoring gene expression: quantitative real-time rt-PCR. Methods Mol Biol 1027: 19–45 (2013).
About the author: